
US Residential Real Estate Market Report - August 2026
Housing Supply Hits 6-Year High as New Listings Jump, Giving Buyers More Bargaining Power
The U.S. housing market shifted further in buyers' favor in August as a surge in new listings gave home shoppers more options and greater negotiating power.
New listings rose 2.6% month over month to 393,178, reaching their highest level since 2022. The increase was led by San Jose, Nashville and Seattle, where homeowners added significantly more properties to the market.
At the same time, the total number of homes for sale increased 3.9% from July to 1,534,918 — the highest level since 2020.
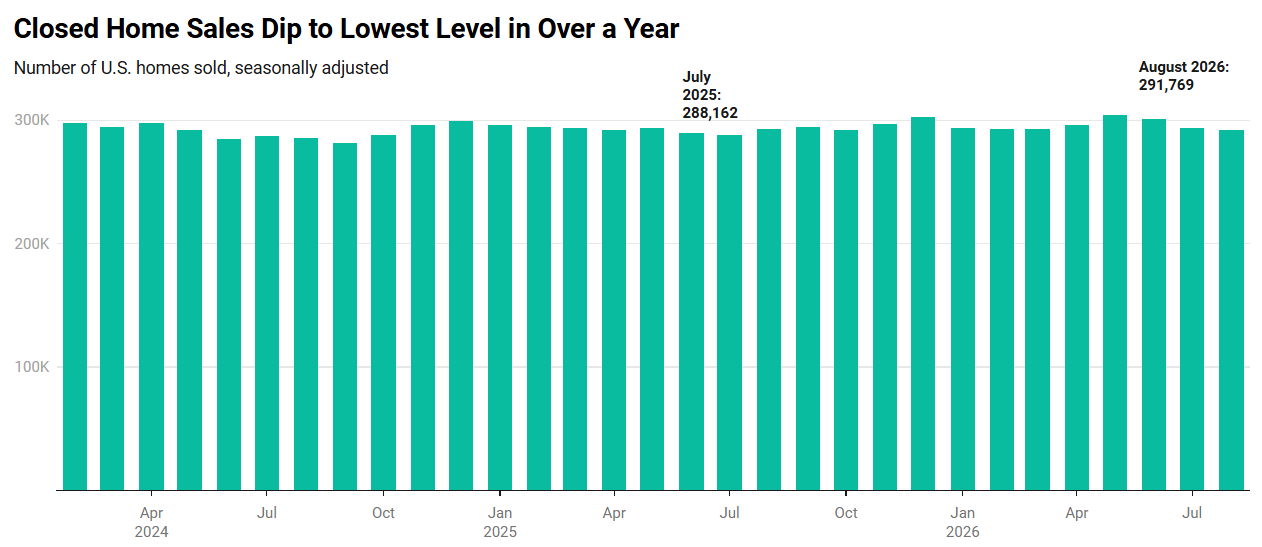
Demand, however, remained essentially flat. Pending home sales increased just 0.1% month over month, while closed home sales declined 0.5% to their lowest level in more than a year.
The combination of rising supply and stalled demand is giving buyers more room to compare properties, negotiate prices and request concessions.
New Listings Jump as More Sellers Enter the Market
The biggest development in August was the increase in fresh housing supply.
New listings rose 2.6% from July to their highest level in more than four years. Year over year, new listings increased 4.3%.
San Jose recorded the largest increase among the major metropolitan areas, with new listings up 25.5% from a year earlier. Nashville followed with a 15.8% increase, while Seattle listings rose 13.7%.
The increase in listings may reflect several factors, including homeowners becoming less affected by mortgage-rate lock-in, life changes prompting moves, and sellers adjusting to a slower housing market.
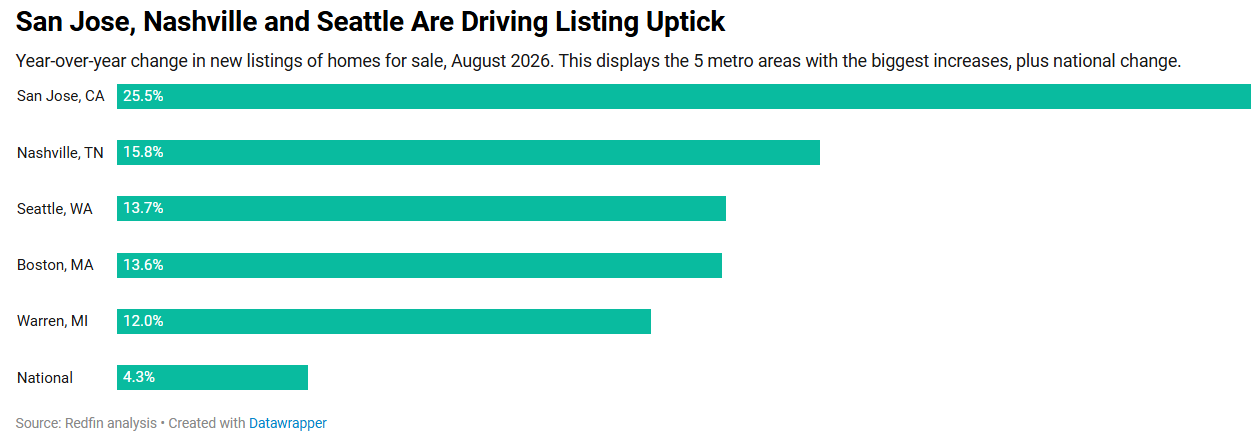
The increase in supply was broad enough to significantly expand the number of homes available to buyers. Total homes for sale rose 3.9% month over month to 1,534,918, reaching the highest level since 2020.
Seattle was the biggest contributor among the major metros, with active listings increasing 24.2% year over year. Boston followed with an 18.7% increase, while San Jose recorded a 17.7% increase.
San Jose, Nashville and Seattle Drive the Listing Increase
The increase in listings is playing out differently across the country.
In San Jose, homeowners may be responding to renewed interest in the Bay Area and increased attention surrounding the technology and artificial intelligence sectors. Despite the increase in listings, San Jose's median sale price fell 2% year over year to $1.5 million.
Nashville continues to have a large supply of homes available to buyers, giving shoppers more choices and allowing them to take more time before making an offer.
Seattle is seeing a different dynamic. New listings increased significantly while demand remained weak. Home prices fell 5.3% year over year to $797,192, pending sales declined 14.2%, and homes are taking longer to attract buyers.
The result is a growing inventory of homes in a market where buyer demand remains cautious.
Homebuying Demand Stalls as Housing Costs Remain High
While supply increased substantially in August, demand showed little movement.
Pending home sales increased just 0.1% from July, leaving them only slightly above July's one-year low.
Closed home sales, which provide a more delayed measure of demand, declined 0.5% month over month to their lowest level in more than a year.
Housing Costs Continue to Be a Major Factor Limiting Demand
The median U.S. home-sale price rose 2.2% year over year to $398,596, the highest August level on record. At the same time, the monthly average 30-year fixed mortgage rate increased to 6.67%, its highest level in more than a year.
The combination of high home prices and elevated mortgage rates is keeping many potential buyers on the sidelines.
Closed Home Sales Dip to Lowest Level in Over a Year
Closed home sales fell to 291,769 in August, down 0.5% from July and 0.4% from a year earlier.
Although sales were relatively weak nationally, there were significant differences between individual markets.
San Francisco recorded the largest year-over-year increase in home sales at 9.5%. Newark followed with an 8.3% increase, while New York sales rose 5.4%.
On the other hand, Houston experienced the largest decline, with home sales down 10.4%. Detroit followed with a 9% decline, while Seattle sales fell 8%.
These differences highlight how localized the housing market has become, with some markets experiencing stronger demand while others face growing inventories and fewer buyers.
Buyers Are Gaining More Negotiating Power
The increase in housing supply is giving buyers more opportunities to negotiate.
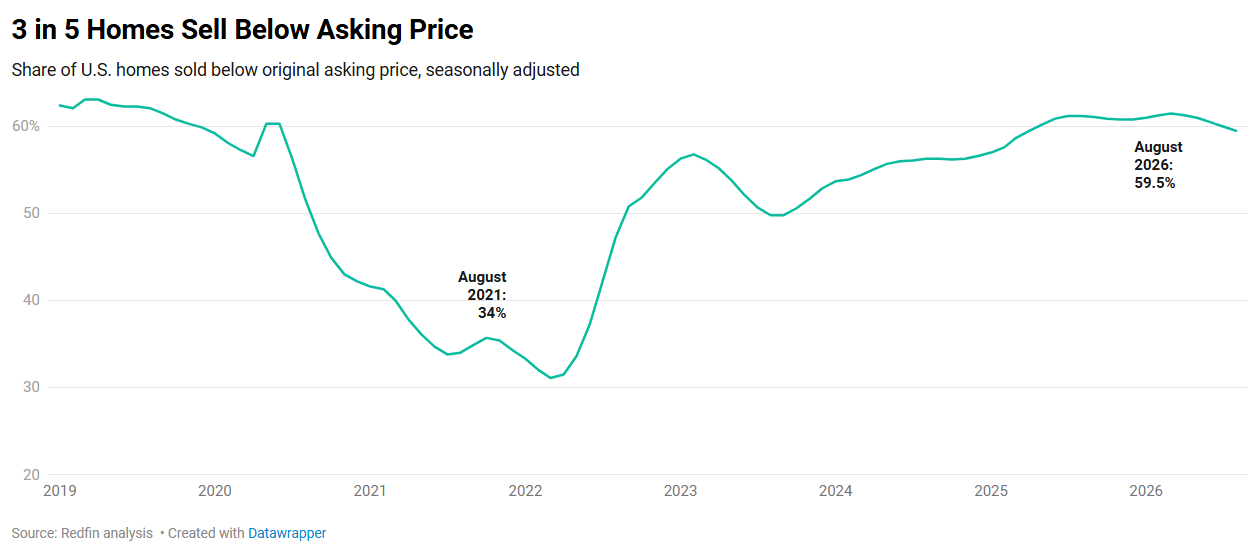
In August, 59.5% of U.S. homes sold below their original asking price. That figure has remained relatively steady over the past year and a half, showing that buyers continue to have room to negotiate in many markets.
The average sale-to-original-list-price ratio was 96.4%, meaning homes that sold typically closed below their original asking prices.
The negotiating environment varies significantly from one metro to another.
West Palm Beach had the highest share of homes selling below asking price, at 85%, followed by Miami at 83%. Austin and San Antonio each recorded 82%, while Dallas came in at 79%.
In contrast, only 30% of homes in San Francisco sold below asking price, the lowest share among the major metros. Newark followed at 33%, San Jose at 38%, and Oakland at 41%.
Limited supply and strong demand are helping keep competition higher in some of these markets.

August 2026 Housing Market Highlights: United States
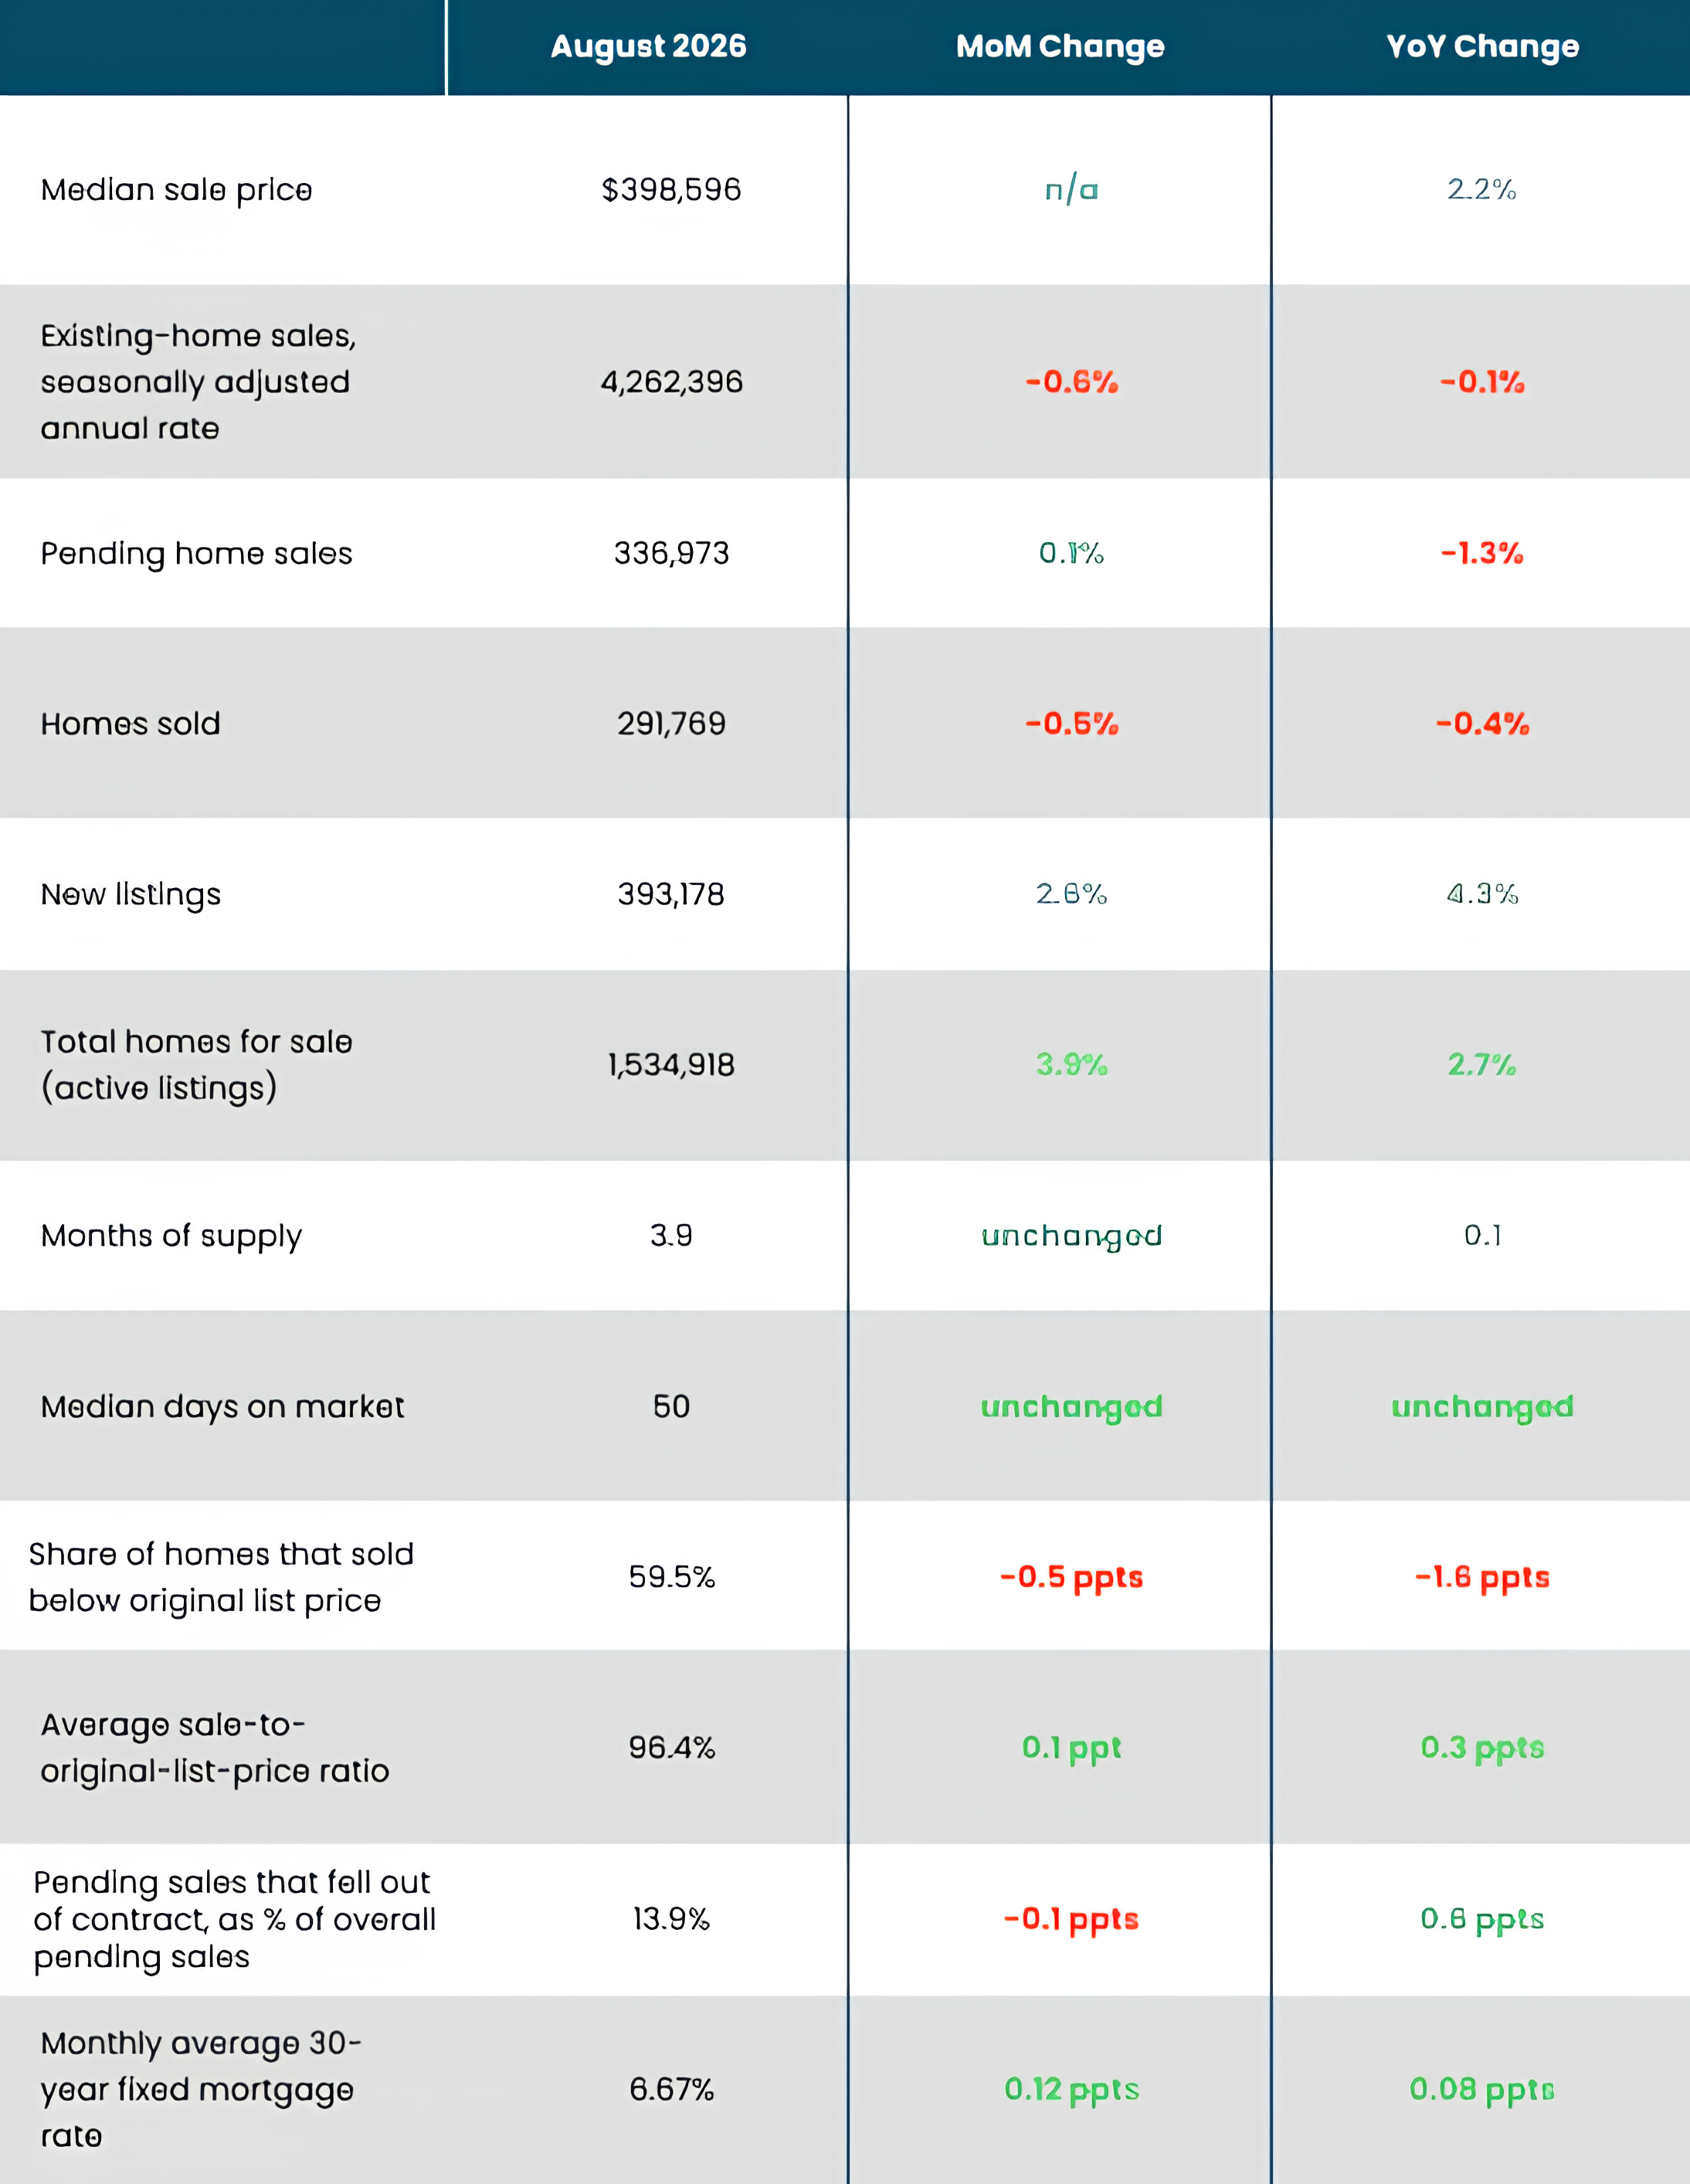
The August data shows a market where supply is expanding faster than demand.
New listings increased 2.6% month over month and 4.3% year over year, while total homes for sale rose 3.9% from July and 2.7% from a year earlier.
Pending sales were essentially unchanged from the previous month, increasing just 0.1%, while closed home sales declined 0.5%.
The median sale price rose 2.2% year over year to $398,596, while the average 30-year mortgage rate increased to 6.67%.
There were 3.9 months of housing supply in August, unchanged from July. The typical home spent 50 days on the market, also unchanged from the previous month and year.
Overall, the increase in inventory combined with relatively weak demand is creating a market where buyers who are financially prepared have more opportunities to negotiate.
August 2026 Metro-Level Highlights
Based on the 50 most populous U.S. metropolitan areas. All changes represent year-over-year changes:
Price Growth Leaders
- West Palm Beach, FL: +8.6%
- Milwaukee, WI: +7.8%
- San Francisco, CA: +7.5%
Largest Price Declines
- Austin, TX: -6.3%
- Seattle, WA: -5.3%
- Fort Worth, TX: -2.6%
Pending Sales Increases
- Milwaukee, WI: +6.5%
- Virginia Beach, VA: +5.2%
- Cincinnati, OH: +5.1%
Biggest Pending Sales Declines
- Seattle, WA: -14.2%
- Denver, CO: -13.5%
- Houston, TX: -11.5%
Closed Sales Gains
- San Francisco, CA: +9.5%
- Newark, NJ: +8.3%
- New York, NY: +5.4%
Closed Sales Declines
- Houston, TX: -10.4%
- Detroit, MI: -9.0%
- Seattle, WA: -8.0%
New Listings Growth
- San Jose, CA: +25.5%
- Nashville, TN: +15.8%
- Seattle, WA: +13.7%
New Listings Declines
- Dallas, TX: -7.4%
- Fort Worth, TX: -6.8%
- Indianapolis, IN: -4.5%
Active Listings Growth
- Seattle, WA: +24.2%
- Boston, MA: +18.7%
- San Jose, CA: +17.7%
Active Listings Declines
- Jacksonville, FL: -15.9%
- Miami, FL: -14.3%
- West Palm Beach, FL: -14.1%
Days on Market — Biggest Increases
- Tampa, FL: +17 days
- Orlando, FL: +10 days
- Philadelphia, PA: +5 days
- Indianapolis, IN: +5 days
- Las Vegas, NV: +5 days
Days on Market — Biggest Decreases
- Jacksonville, FL: -14 days
- West Palm Beach, FL: -13 days
- San Diego, CA: -12 days