
US Residential Real Estate Market Report
- July 2026
Home Sales Fall to Lowest Level in Nearly Two Years as High Costs and Economic Uncertainty Weigh on Buyers
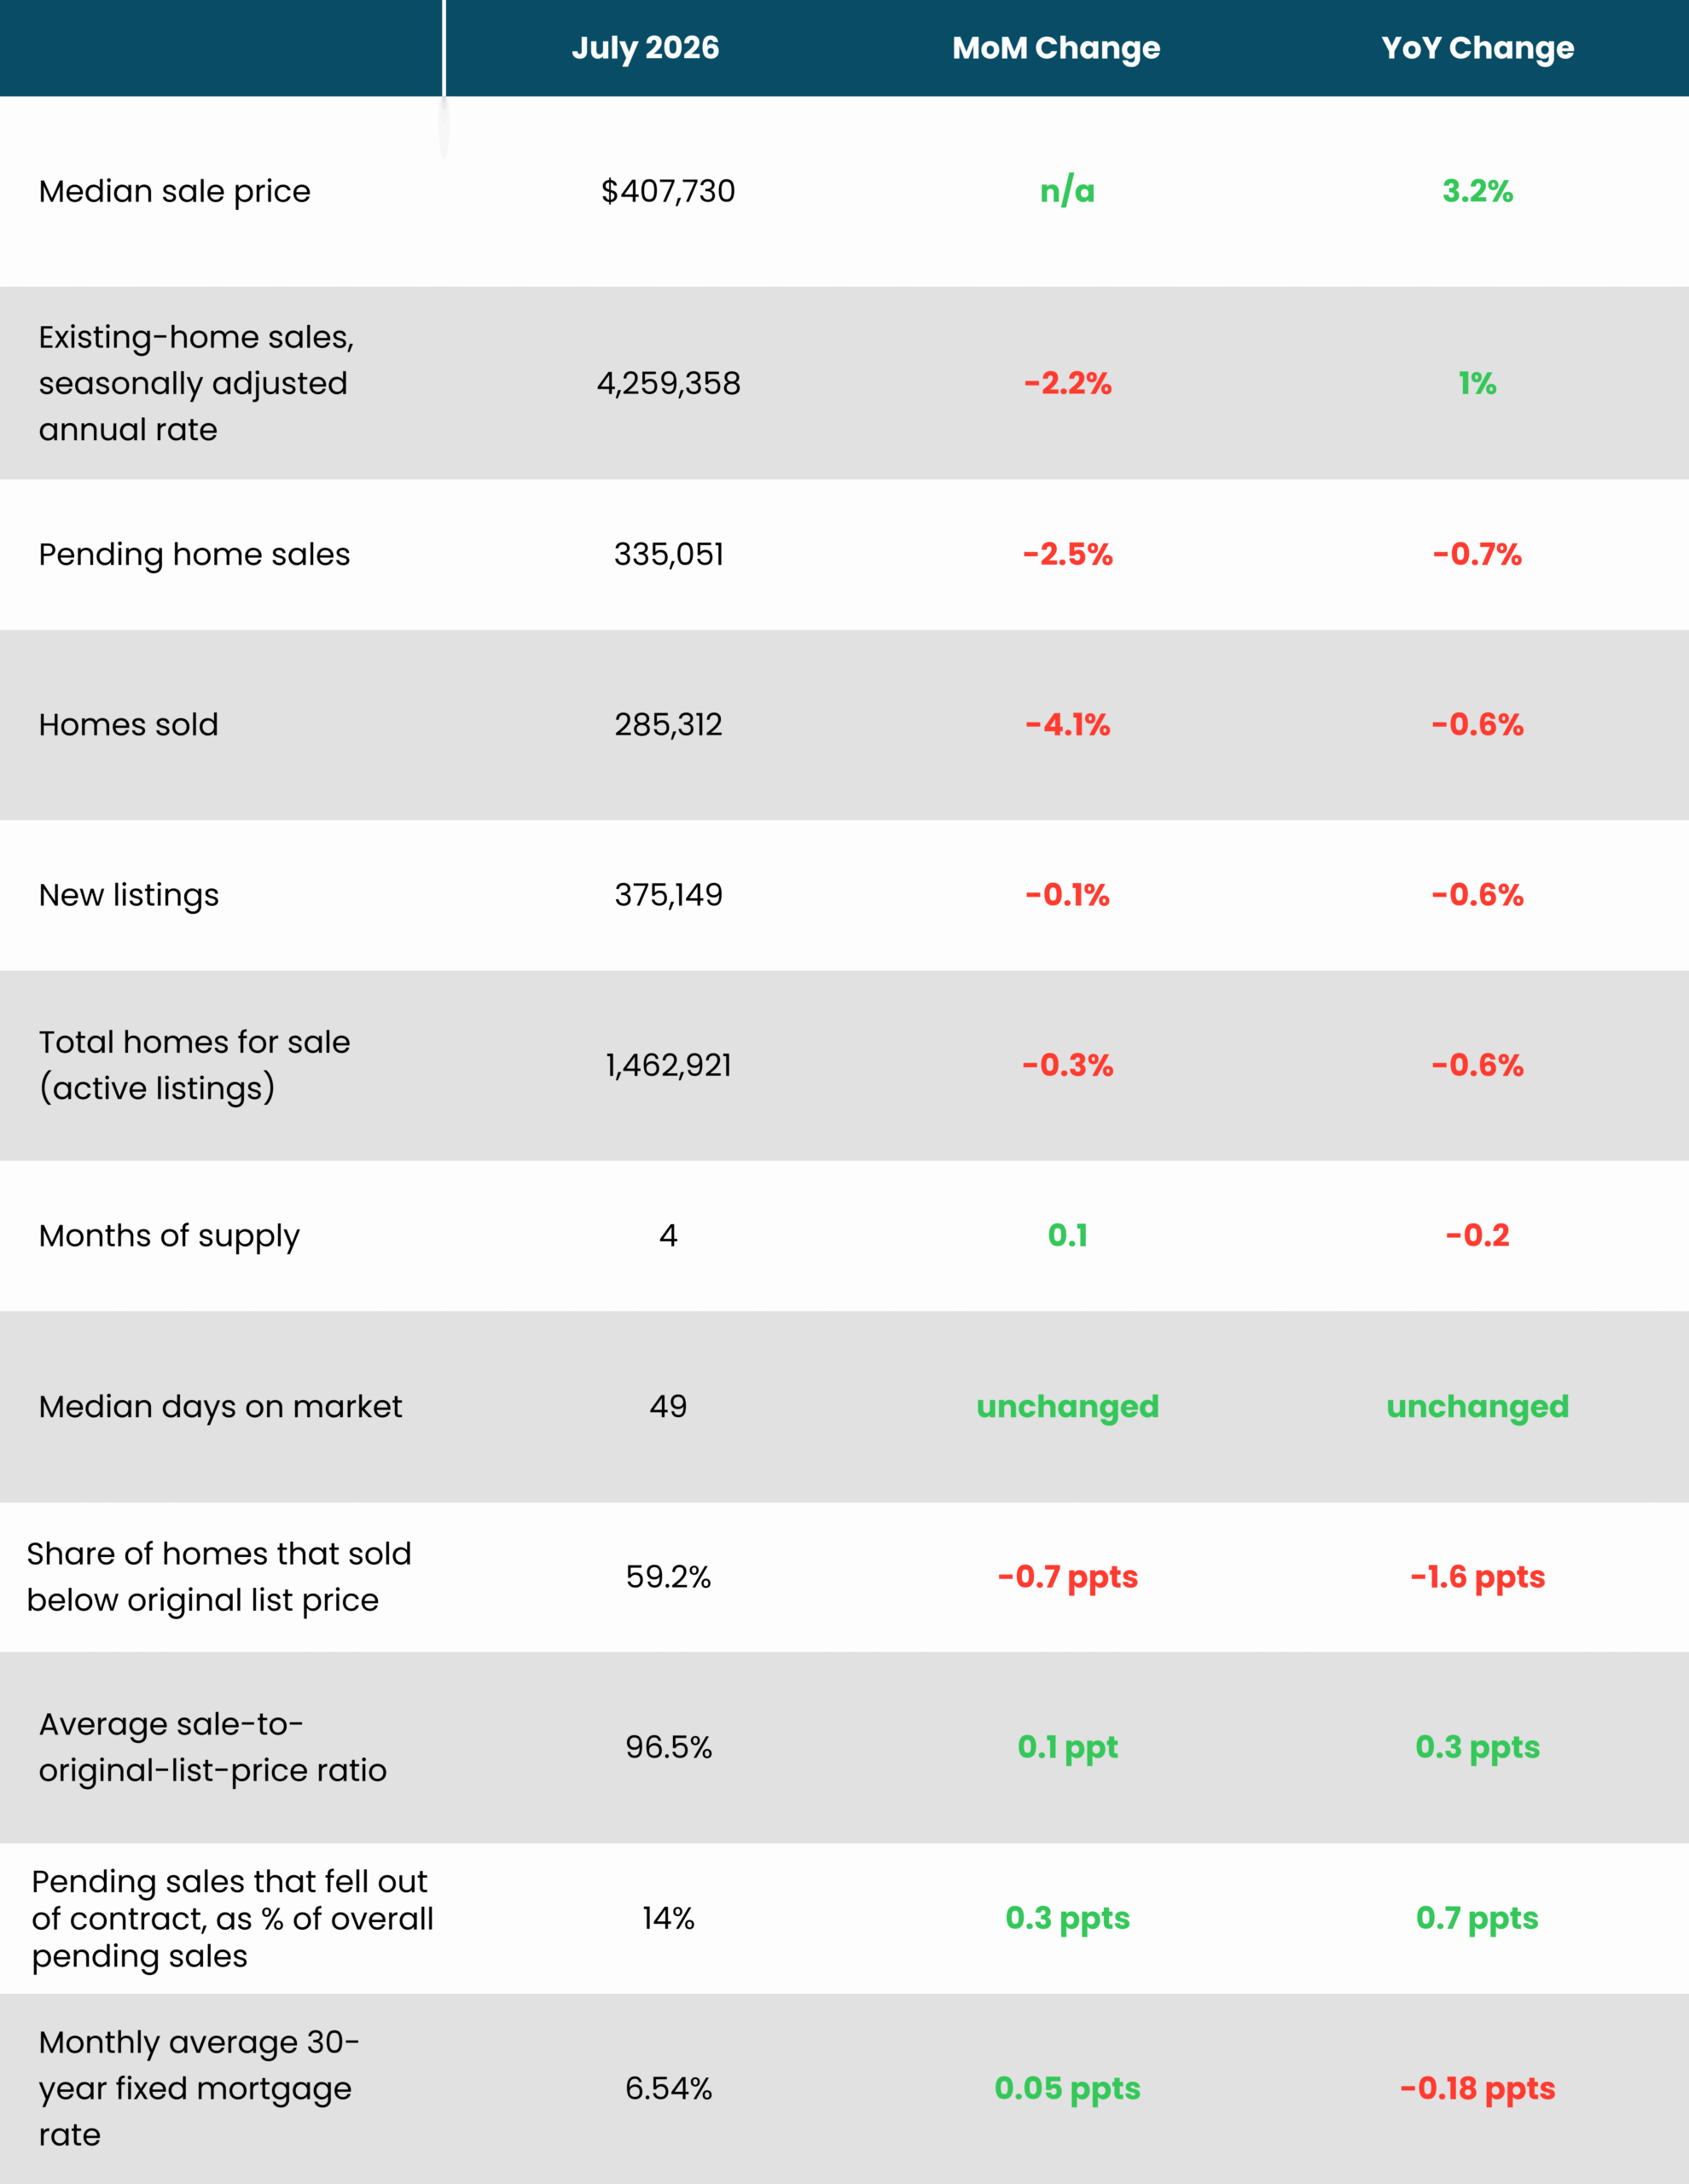
The U.S. housing market slowed noticeably in July as near-record home prices, elevated mortgage rates, and economic uncertainty weighed on homebuyers. Existing-home sales fell 4.1% from a month earlier, dropping to their lowest level in nearly two years on a seasonally adjusted basis.
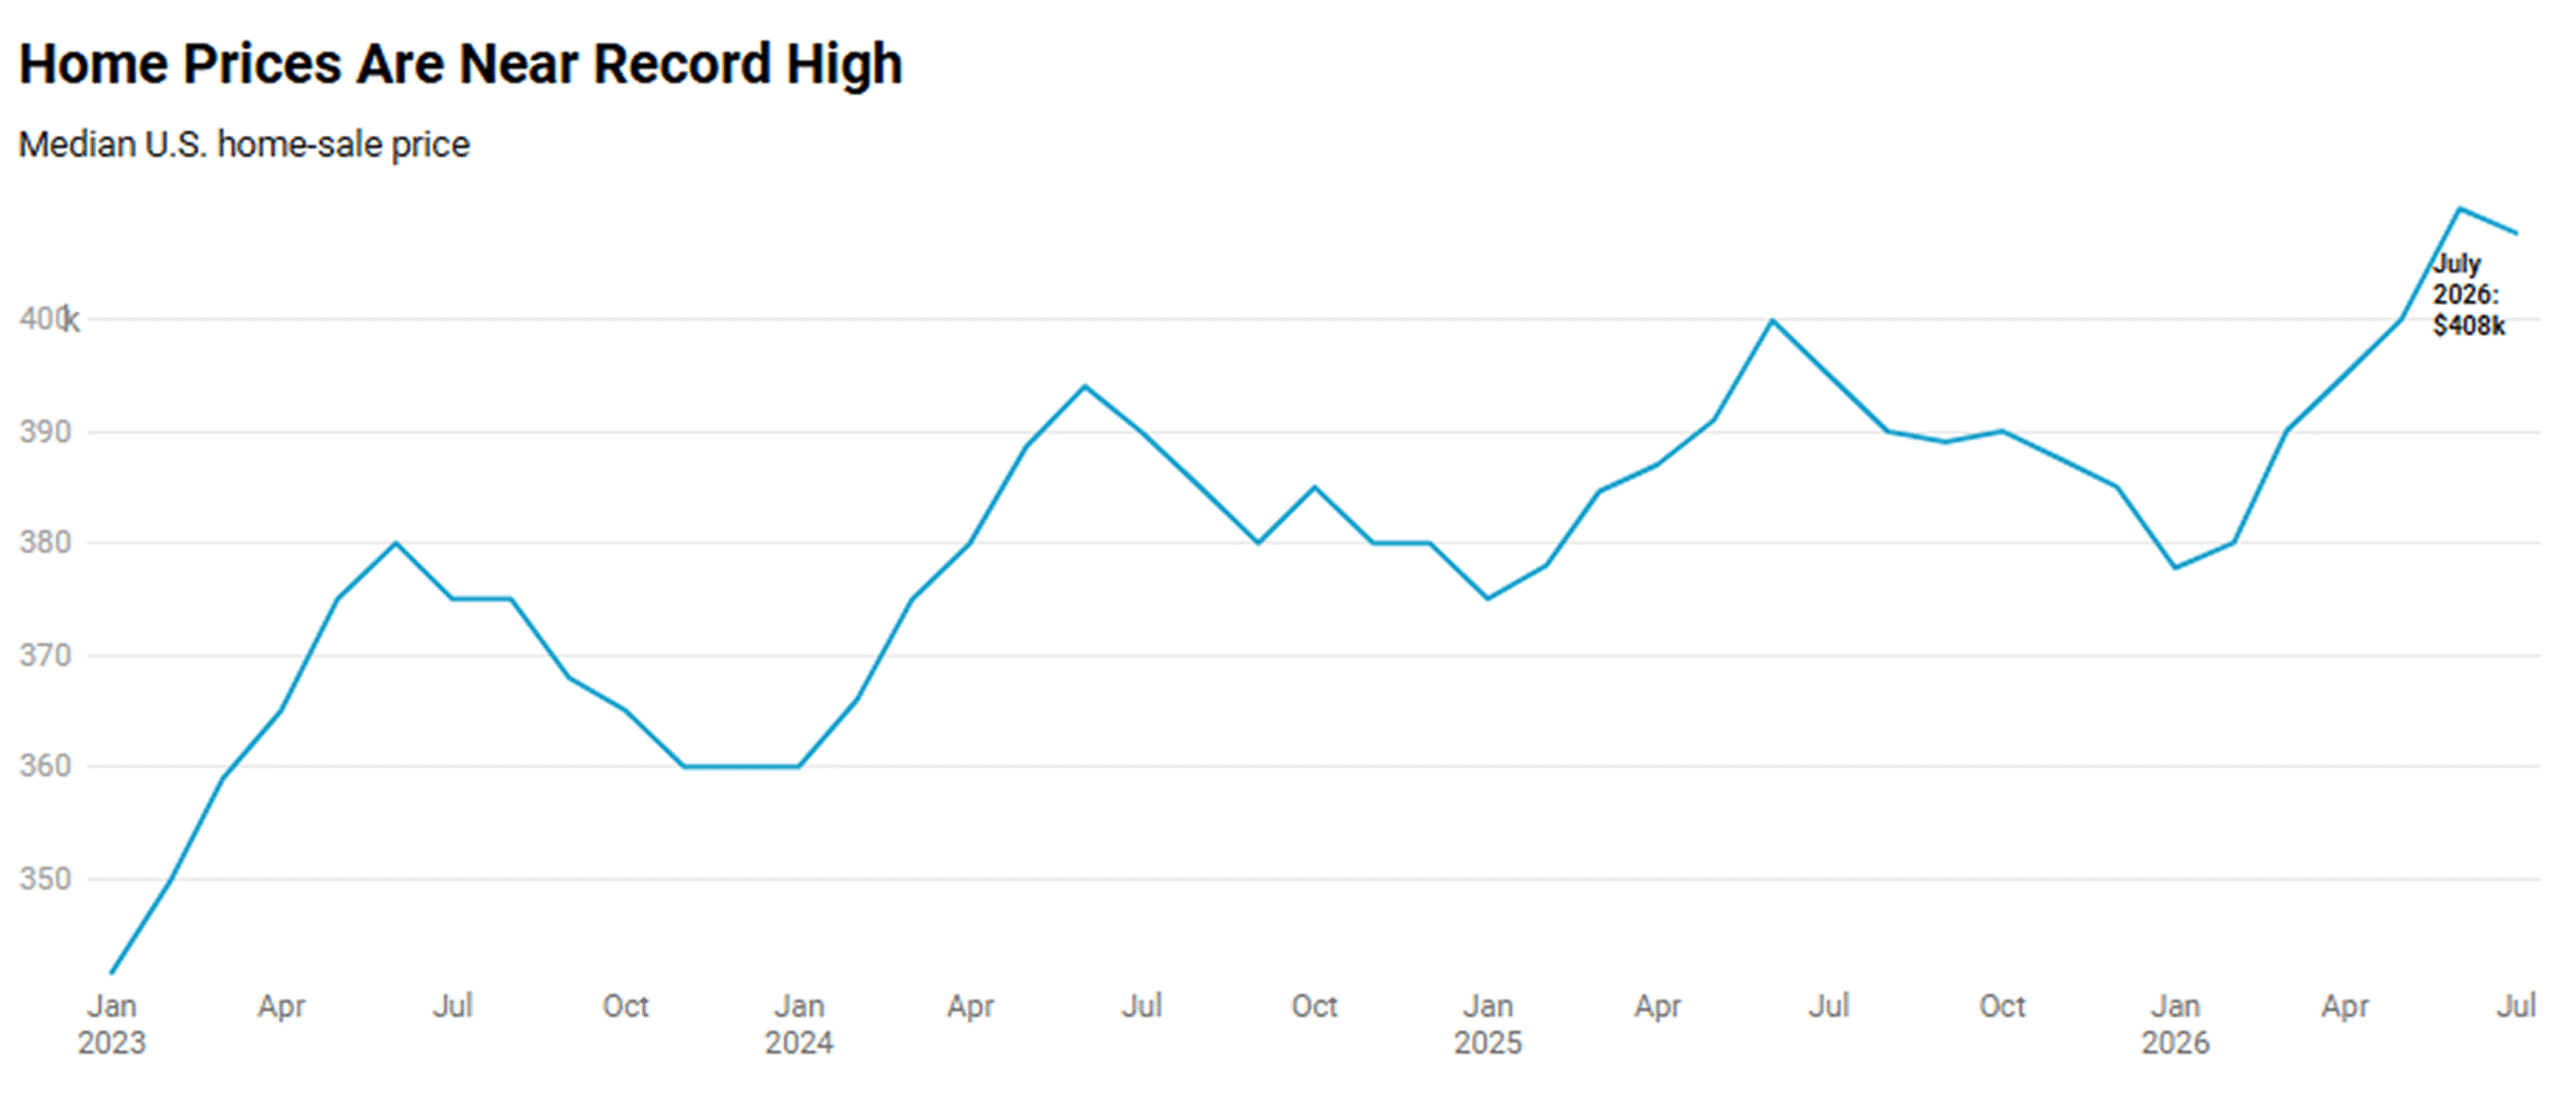
Pending home sales, an important indicator of future homebuying activity, also declined 2.5% month over month to their lowest level since December. At the same time, the median U.S. home-sale price continued to climb, rising 3.2% year over year to $407,730—the highest July level on record.
Higher housing costs remain one of the biggest obstacles for buyers. The monthly average 30-year fixed mortgage rate increased to 6.54%, its highest level in a year, making already-expensive homes even harder for many households to afford.
High Housing Costs Are Holding Buyers Back
Homebuying demand weakened in July as buyers faced a combination of high prices and elevated mortgage rates.
The median U.S. home-sale price increased 3.2% from a year earlier to $407,730, keeping prices close to record levels. Meanwhile, the average 30-year mortgage rate reached 6.54%.
For many potential buyers, the combination of higher borrowing costs and near-record home prices has pushed monthly housing payments beyond what they can comfortably afford.
Economic uncertainty also played a role. Concerns surrounding the labor market, inflation, and the broader economy caused some households to delay making a major financial commitment.
Some buyers who did enter the market also backed out of deals. In July, 14% of home-sale agreements fell through, the highest share since 2023.
"The housing market suffered from a mid-summer slump in July as would-be buyers grappled with record-high home prices, increasing mortgage rates and growing financial insecurity."
For buyers who remain financially prepared, however, the slowdown could create opportunities to negotiate on price and request concessions from sellers who are eager to close.
Home Sales Drop to Lowest Level in Nearly Two Years
Existing-home sales declined 4.1% from June, bringing activity to its lowest level in nearly two years on a seasonally adjusted basis.
The decline reflects the broader affordability challenges facing the housing market. While some buyers remain active, many households are finding that the cost of purchasing a home is simply too high.
Pending sales also weakened, falling 2.5% from the previous month and reaching their lowest level since December. Because pending sales typically provide an indication of future closed sales, the decline suggests that housing activity could remain subdued in the near term.
The slowdown was not limited to completed transactions. Both buyers and sellers showed signs of pulling back during the month, creating a market with less activity on both sides.
Home Prices Continue to Rise Despite Slower Activity
The national housing market remains unusual because prices are continuing to rise even as sales activity weakens.
The median U.S. home-sale price reached $407,730 in July, up 3.2% year over year and representing the highest July price on record.
Limited affordability is preventing many buyers from participating, while homeowners who are reluctant to give up existing low mortgage rates are also less likely to sell. This combination is helping keep housing inventory relatively constrained even as demand softens.
The result is a market where prices remain elevated despite weaker sales activity.
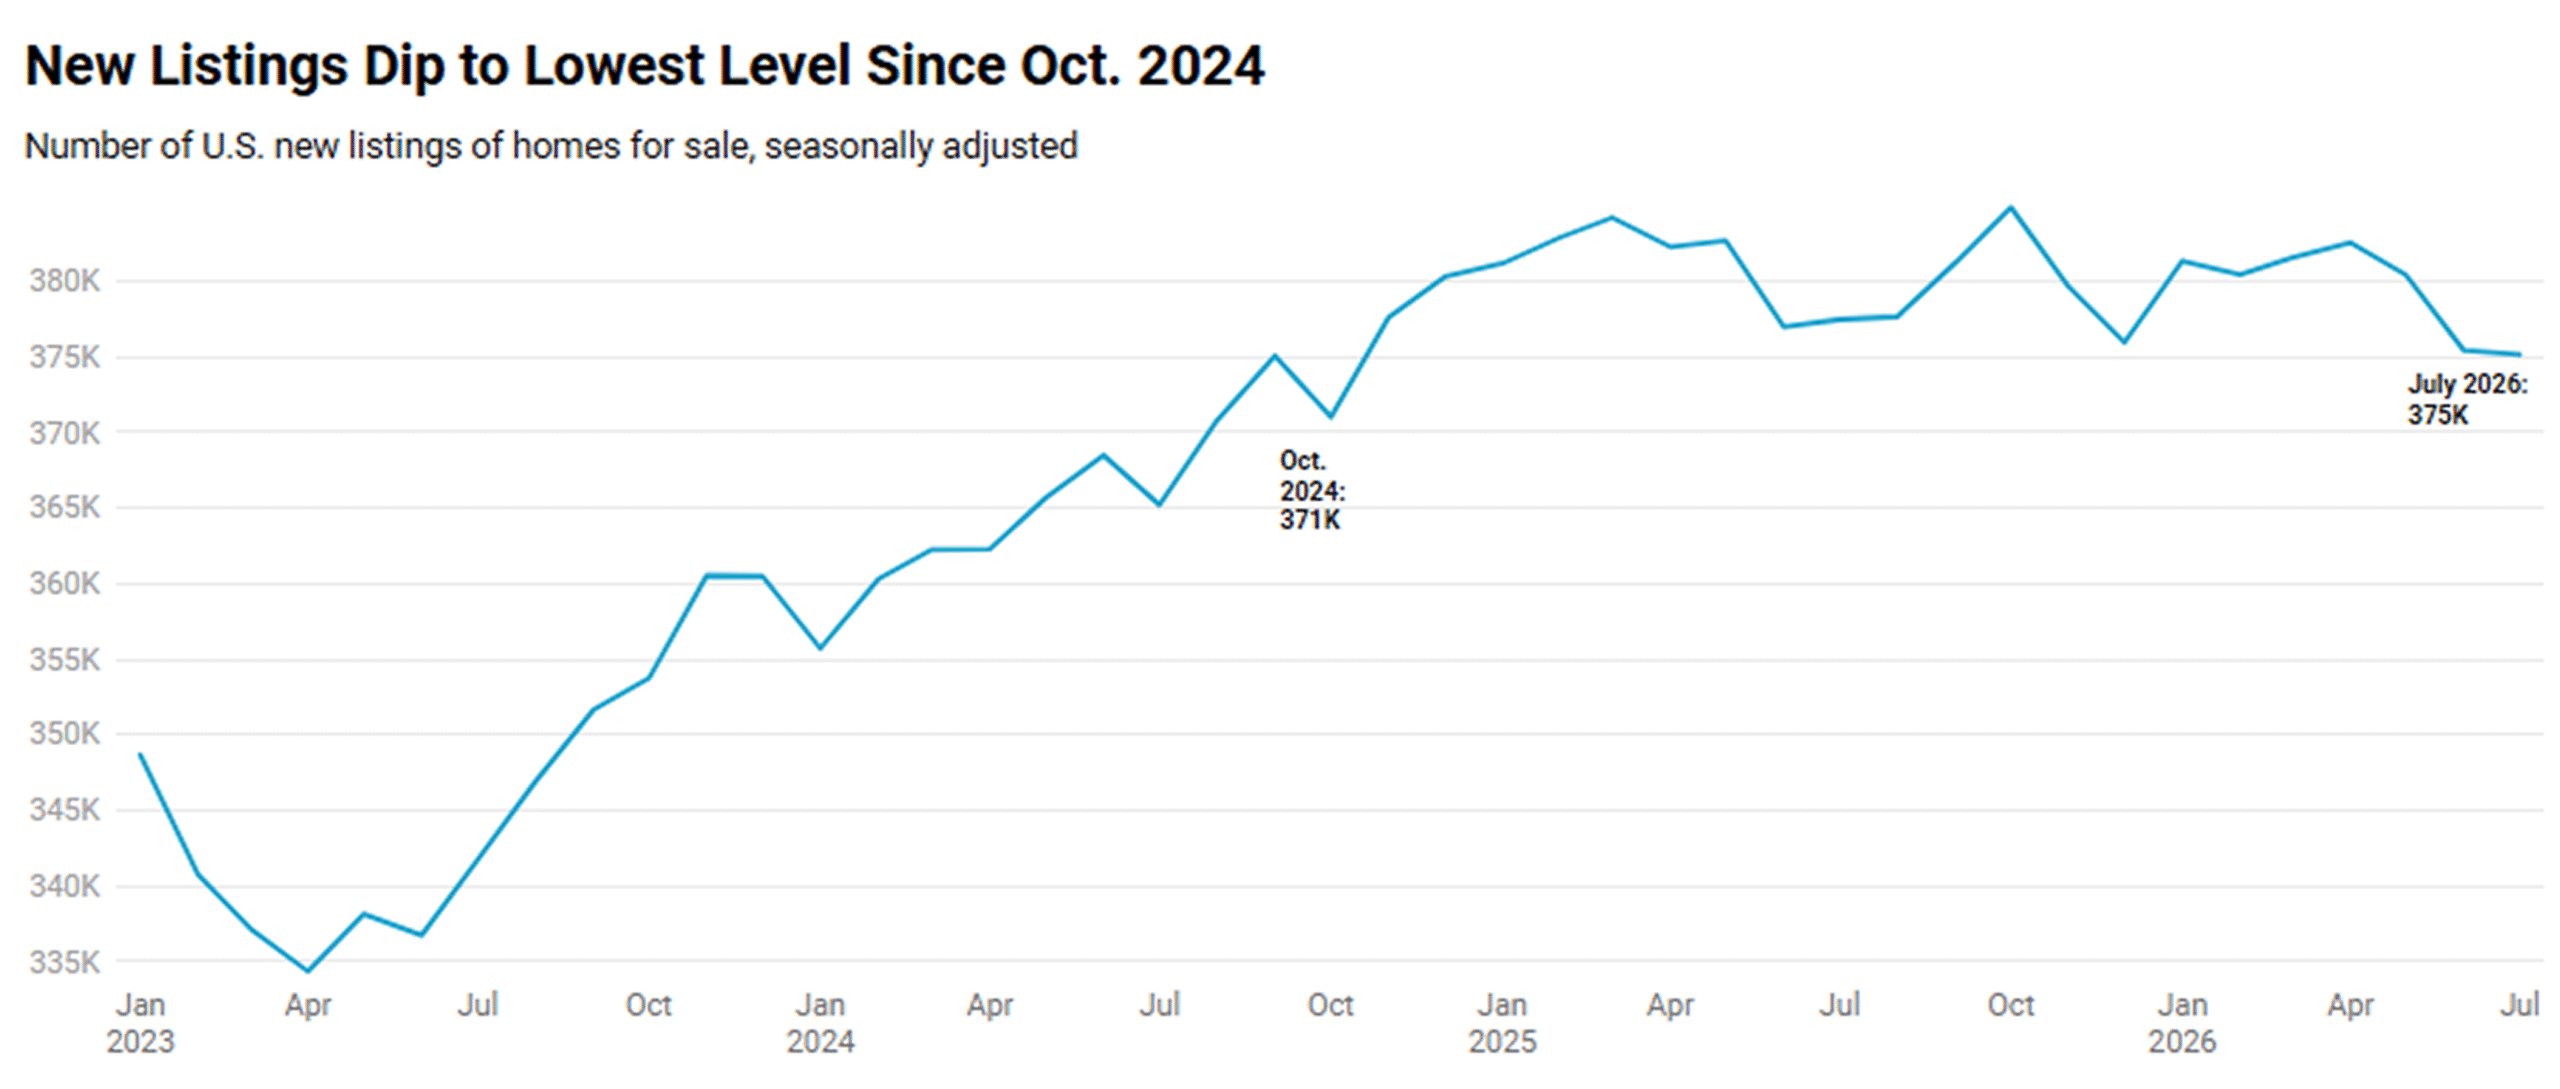
New Listings Dip to Their Lowest Level Since October 2024
Sellers also pulled back in July.
New listings declined 0.1% from June to 375,149, reaching their lowest level since October 2024. High mortgage rates are discouraging some homeowners from listing their properties, particularly those who currently have much lower mortgage rates and would face a significantly higher payment if they moved.
Other potential sellers are holding off because they are aware that buyer demand remains subdued.
The total number of homes for sale also declined slightly, falling 0.3% month over month to 1,462,921 active listings.
At the same time, sluggish demand means homes that do come onto the market are taking longer to sell, preventing inventory from falling more sharply.
Buyers May Have More Negotiating Power
Although affordability remains a major challenge, the slowdown in demand is creating more leverage for buyers who can afford to purchase.
Homes are no longer moving as quickly as they did during the strongest periods of the housing boom, and sellers are facing a market where buyers have more opportunities to negotiate.
In July, 59.2% of homes sold below their original list price—the average sale-to-original-list-price ratio was 96.5%, meaning the typical home that sold closed below its initial asking price.
The median home spent 49 days on the market, unchanged from a year earlier.
For buyers with strong finances, this environment may provide opportunities to negotiate lower prices or secure seller concessions. However, affordability remains the biggest barrier for households that have not yet entered the market.

July 2026 Housing Market Highlights: United States
July 2026 Metro-Level Highlights
Based on the 50 most populous U.S. metropolitan areas. All changes represent year-over-year changes:
Price Growth Leaders
- West Palm Beach, FL: +9.9%
- Pittsburgh, PA: +6.8%
- Newark, NJ: +6.6%
Largest Price Declines
- San Jose, CA: -4.0%
- Seattle, WA: -3.8%
- Dallas, TX: -0.8%
Pending Sales Increases
- West Palm Beach, FL: +14.2%
- Milwaukee, WI: +4.5%
- Pittsburgh, PA: +3.0%
Biggest Pending Sales Declines
- Seattle, WA: -15.6%
- Houston, TX: -14.3%
- Phoenix, AZ: -13.3%
Closed Sales Gains
- West Palm Beach, FL: +17.1%
- San Francisco, CA: +8.5%
- Milwaukee, WI: +7.0%
Closed Sales Declines
- San Antonio, TX: -12.6%
- Dallas, TX: -10.0%
- Fort Worth, TX: -9.9%
New Listings Growth
- St. Louis, MO: +17.8%
- San Jose, CA: +10.5%
- Warren, MI: +9.8%
New Listings Declines
- Miami, FL: -9.3%
- Dallas, TX: -7.8%
- San Antonio, TX: -7.8%
Active Listings Growth
- Seattle, WA: +16.7%
- St. Louis, MO: +13.0%
- Cincinnati, OH: +13.5%
Active Listings Declines
- Jacksonville, FL: -16.8%
- San Francisco, CA: -16.4%
- Miami, FL: -16.0%
Longest Days on Market Increases
- Indianapolis, IN: +7 days
- Houston, TX: +7 days
- Nashville, TN: +7 days
Shortest Days on Market / Biggest Decreases
- West Palm Beach, FL: -16 days
- Jacksonville, FL: -9 days
- Riverside, CA: -9 days