
US Residential Real Estate Market Report
-June 2026
U.S. Home Prices Reach a Record High as Buyer Demand Continues to Strengthen
The U.S. housing market continued to gain momentum in June 2026, with home prices reaching a new record high as buyer demand remained resilient despite elevated mortgage rates.
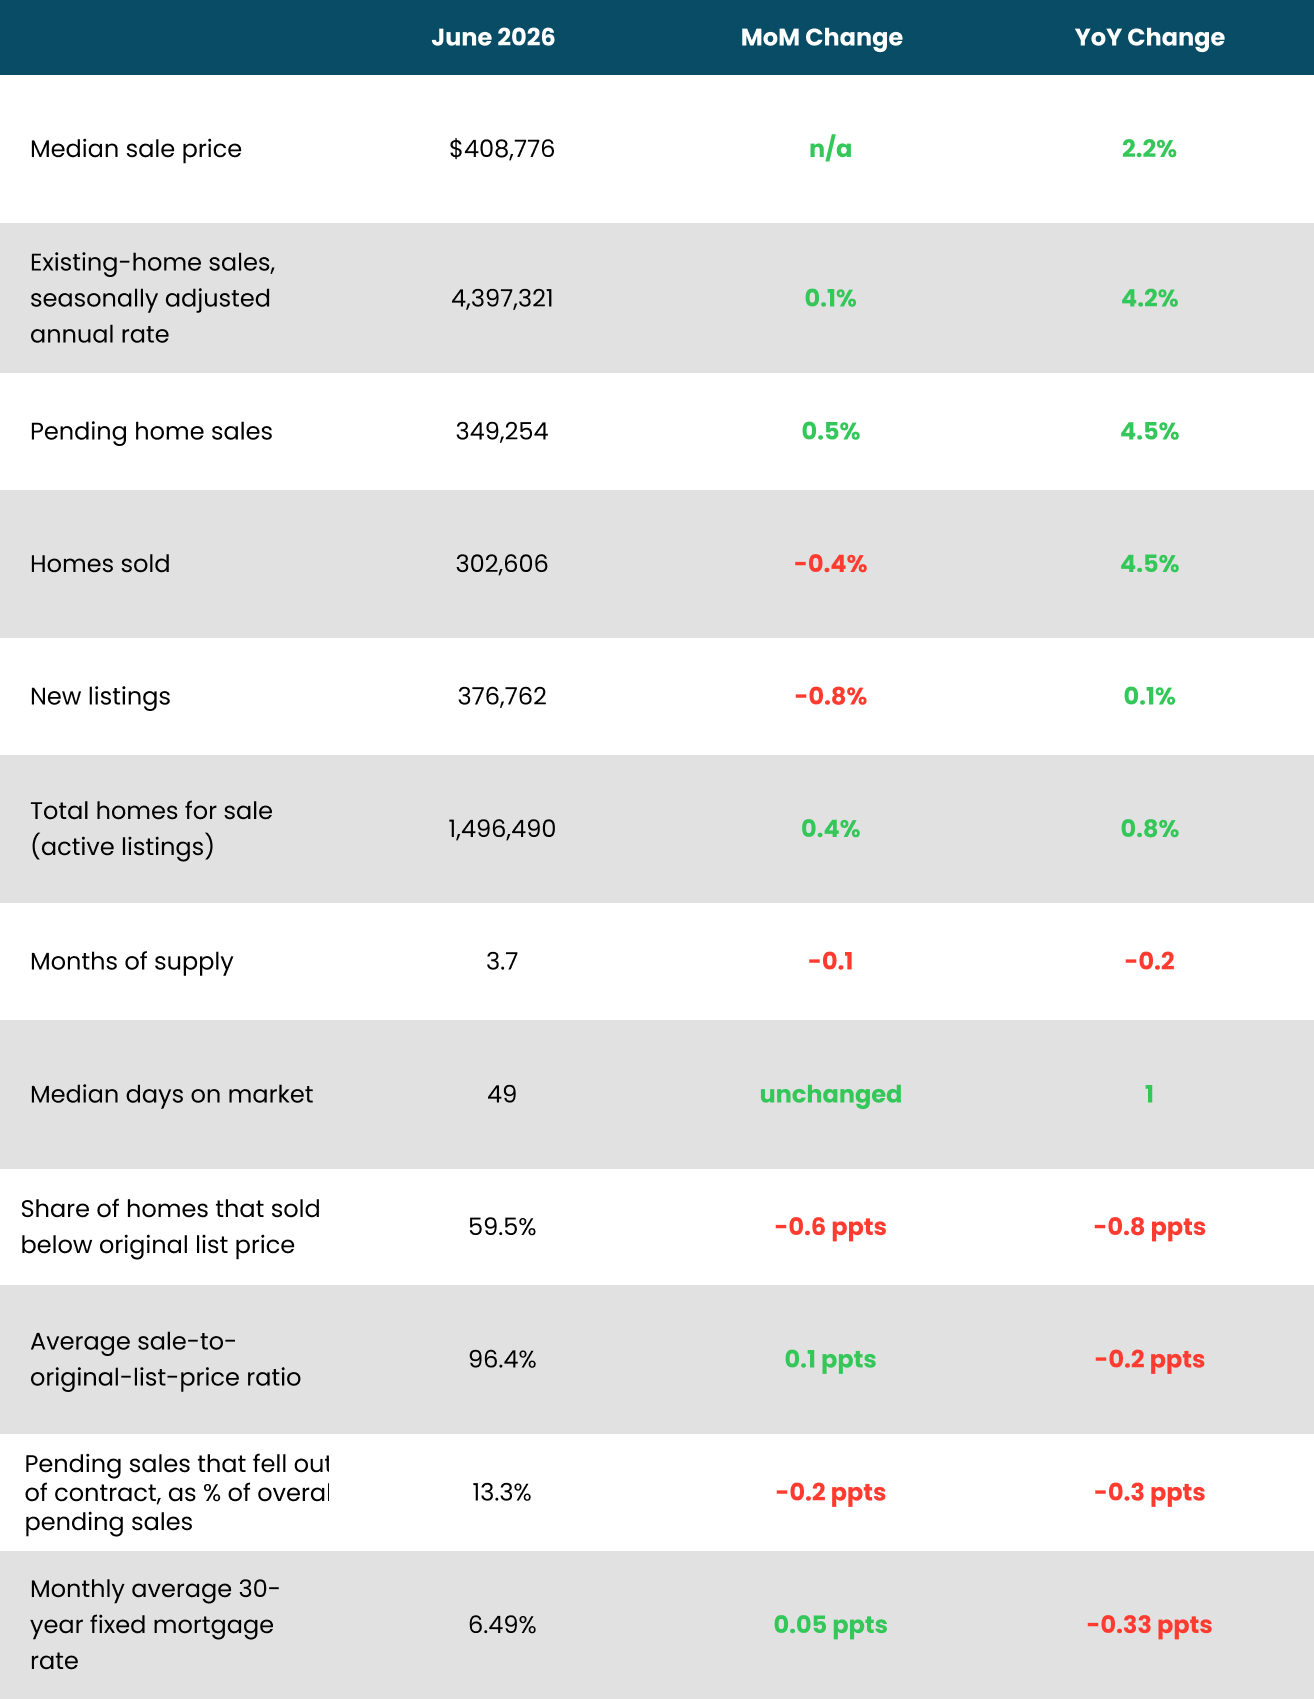
The median U.S. home sale price climbed 2.2% year over year to an all-time high of $408,776, supported by improving sales activity and strong demand in several high-performing markets.
Buyer Demand Remains Strong
Homebuying activity continued to improve during June.
Existing-home sales reached their highest level since late 2022, while pending home sales climbed to one of their strongest levels in the past three years.
Several factors contributed to stronger demand:
A stable job market continued to support consumer confidence
Wage growth helped offset some affordability challenges
Buyers remained active despite mortgage rates hovering around 6.5%
Competitive markets continued attracting well-qualified purchasers
Although mortgage rates remain elevated, many buyers have adjusted to the current financing environment and are moving forward with home purchases.
High-End Markets Continue to Lead
Some of the strongest housing activity came from luxury and high-income markets.
Several coastal metros experienced notable gains in both home prices and sales activity, driven by affluent buyers and limited inventory. Strong demand for luxury properties continued to support price appreciation in these markets, even as affordability challenges persisted elsewhere.
Meanwhile, many other markets also benefited from higher-income buyers who remain less affected by rising borrowing costs.
Home Prices Continue to Rise at a Sustainable Pace
While home prices reached a record high, appreciation remains much more moderate than during the pandemic housing boom.
Current price growth is significantly lower than the double-digit increases seen in 2021 and 2022, creating a healthier and more sustainable market environment.
Additionally, wage growth has recently outpaced home price growth, helping improve affordability for some buyers.
Competition Is Increasing
The housing market has become slightly more competitive as buyer activity strengthens.
More than one in five homes sold above the original asking price in June—the highest share in over a year.
This indicates that desirable, well-priced homes continue to attract multiple offers, particularly in markets where inventory remains limited.
Even so, buyers still have more negotiating opportunities than they did during the height of the housing boom.


Fewer Sellers Are Listing Their Homes
While buyer demand improved, new listings declined slightly during June.
Some homeowners are choosing to wait before selling as they monitor market conditions and mortgage rates. Others are reluctant to give up the lower mortgage rates they secured in previous years.
As a result, the number of newly listed homes fell to its lowest level in several months, particularly in markets where buyers already hold the strongest negotiating power.
What This Means for Buyers and Sellers
For Buyers:
Demand is increasing, creating more competition for desirable homes
Mortgage rates remain elevated but buyers are adapting
Acting quickly on well-priced homes may become increasingly important
For Sellers:
Record home prices continue to support strong selling opportunities
Proper pricing remains essential, as buyers are still value-conscious
Limited new inventory may benefit sellers in many local markets
Key Takeaway
The housing market continued to strengthen in June, with record home prices, improving sales activity, and growing buyer confidence signaling a healthier market than earlier in the year.
Although affordability challenges and higher mortgage rates remain, demand has proven resilient, particularly in higher-end markets. At the same time, fewer new listings are helping support prices by limiting available inventory.
Overall, the market appears to be settling into a more balanced environment—one with steady price growth, improving buyer activity, and opportunities for both buyers and sellers who approach the market with realistic expectations and sound strategy.
June 2026 Housing Market Highlights: United States
Metro-Level Highlights (Year Over Year)
Based on the 50 most populous U.S. metropolitan areas:
Price Growth Leaders
- San Francisco, CA: +9.2%
- Pittsburgh, PA: +9.1%
- West Palm Beach, FL: +8.6%
Largest Price Declines
- Seattle, WA: -4.9%
- San Jose, CA: -3.9%
- Portland, OR: -1.8%
Pending Sales Increases
- San Francisco, CA: +16.4%
- Austin, TX: +13.2%
- West Palm Beach, FL: +13.0%
Biggest Pending Sales Declines
- Seattle, WA: -10.8%
- Houston, TX: -10.5%
- Denver, CO: -3.1%
Closed Sales Gains
- West Palm Beach, FL: +23.8%
- San Francisco, CA: +23.1%
- San Diego, CA: +12.8%
Closed Sales Declines
- Philadelphia, PA: -6.8%
- Seattle, WA: -5.9%
- Atlanta, GA: -3.7%
New Listings Growth
- Philadelphia, PA: +16.7%
- Anaheim, CA: +15.0%
- St. Louis, MO: +13.0%
New Listings Declines
- Dallas, TX: -6.5%
- Fort Worth, TX: -6.2%
- Jacksonville, FL: -5.5%
Active Listings Growth
- Cincinnati, OH: +15.0%
- Boston, MA: +14.1%
- St. Louis, MO: +13.3%
Active Listings Declines
- Jacksonville, FL: -16.6%
- San Francisco, CA: -15.7%
- Miami, FL: -13.5%
Longest Days on Market
- Seattle, WA: +9 days
- Nashville, TN: +8 days
- Las Vegas, NV: +8 days
Shortest Days on Market
- West Palm Beach, FL: 81 days (-8 days YoY)
- Jacksonville, FL: -7 days
- Newark, NJ: -7 days