
US Residential Real Estate Market Report - March 2026
Home Prices Surge in Tech-Driven Markets While National Activity Slows
As the 2026 housing market unfolds, a clear contrast is emerging between high-demand tech hubs and the broader national market. While most of the country is experiencing slower activity, certain metros are seeing rapid price growth fueled by strong demand and limited supply.
Tech Hubs Are Driving Price Growth
In major West Coast metro areas, home prices jumped over 14% year over year in March, marking the fastest growth the nation has seen and pushing median prices to around $1.7 million.
Condo prices in that same market rose even more sharply, increasing over 24% compared to last year—the largest gain in more than a decade.
This surge is being driven by a combination of factors:
Rapid expansion in the artificial intelligence and tech sectors
An influx of high-income buyers entering the market
A continued shortage of available homes
More employees returning to in-person work
Together, these trends are creating intense competition, especially for well-presented homes in desirable neighborhoods. In some cases, properties are receiving multiple offers and selling significantly above asking price.
Low Inventory Is Fueling Competition
Housing supply remains tight in high-demand areas, with less than two months of inventory available in some markets. For context, a balanced market typically has closer to five or six months of supply.
This limited inventory is pushing prices higher and creating urgency among buyers who are ready and able to compete.
For sellers, this creates a strong opportunity—but preparation still matters. Homes that are clean, staged, and move-in ready tend to attract more attention and stronger offers.
National Market Remains More Cautious
While select metros are heating up, the broader U.S. housing market is moving at a slower pace:
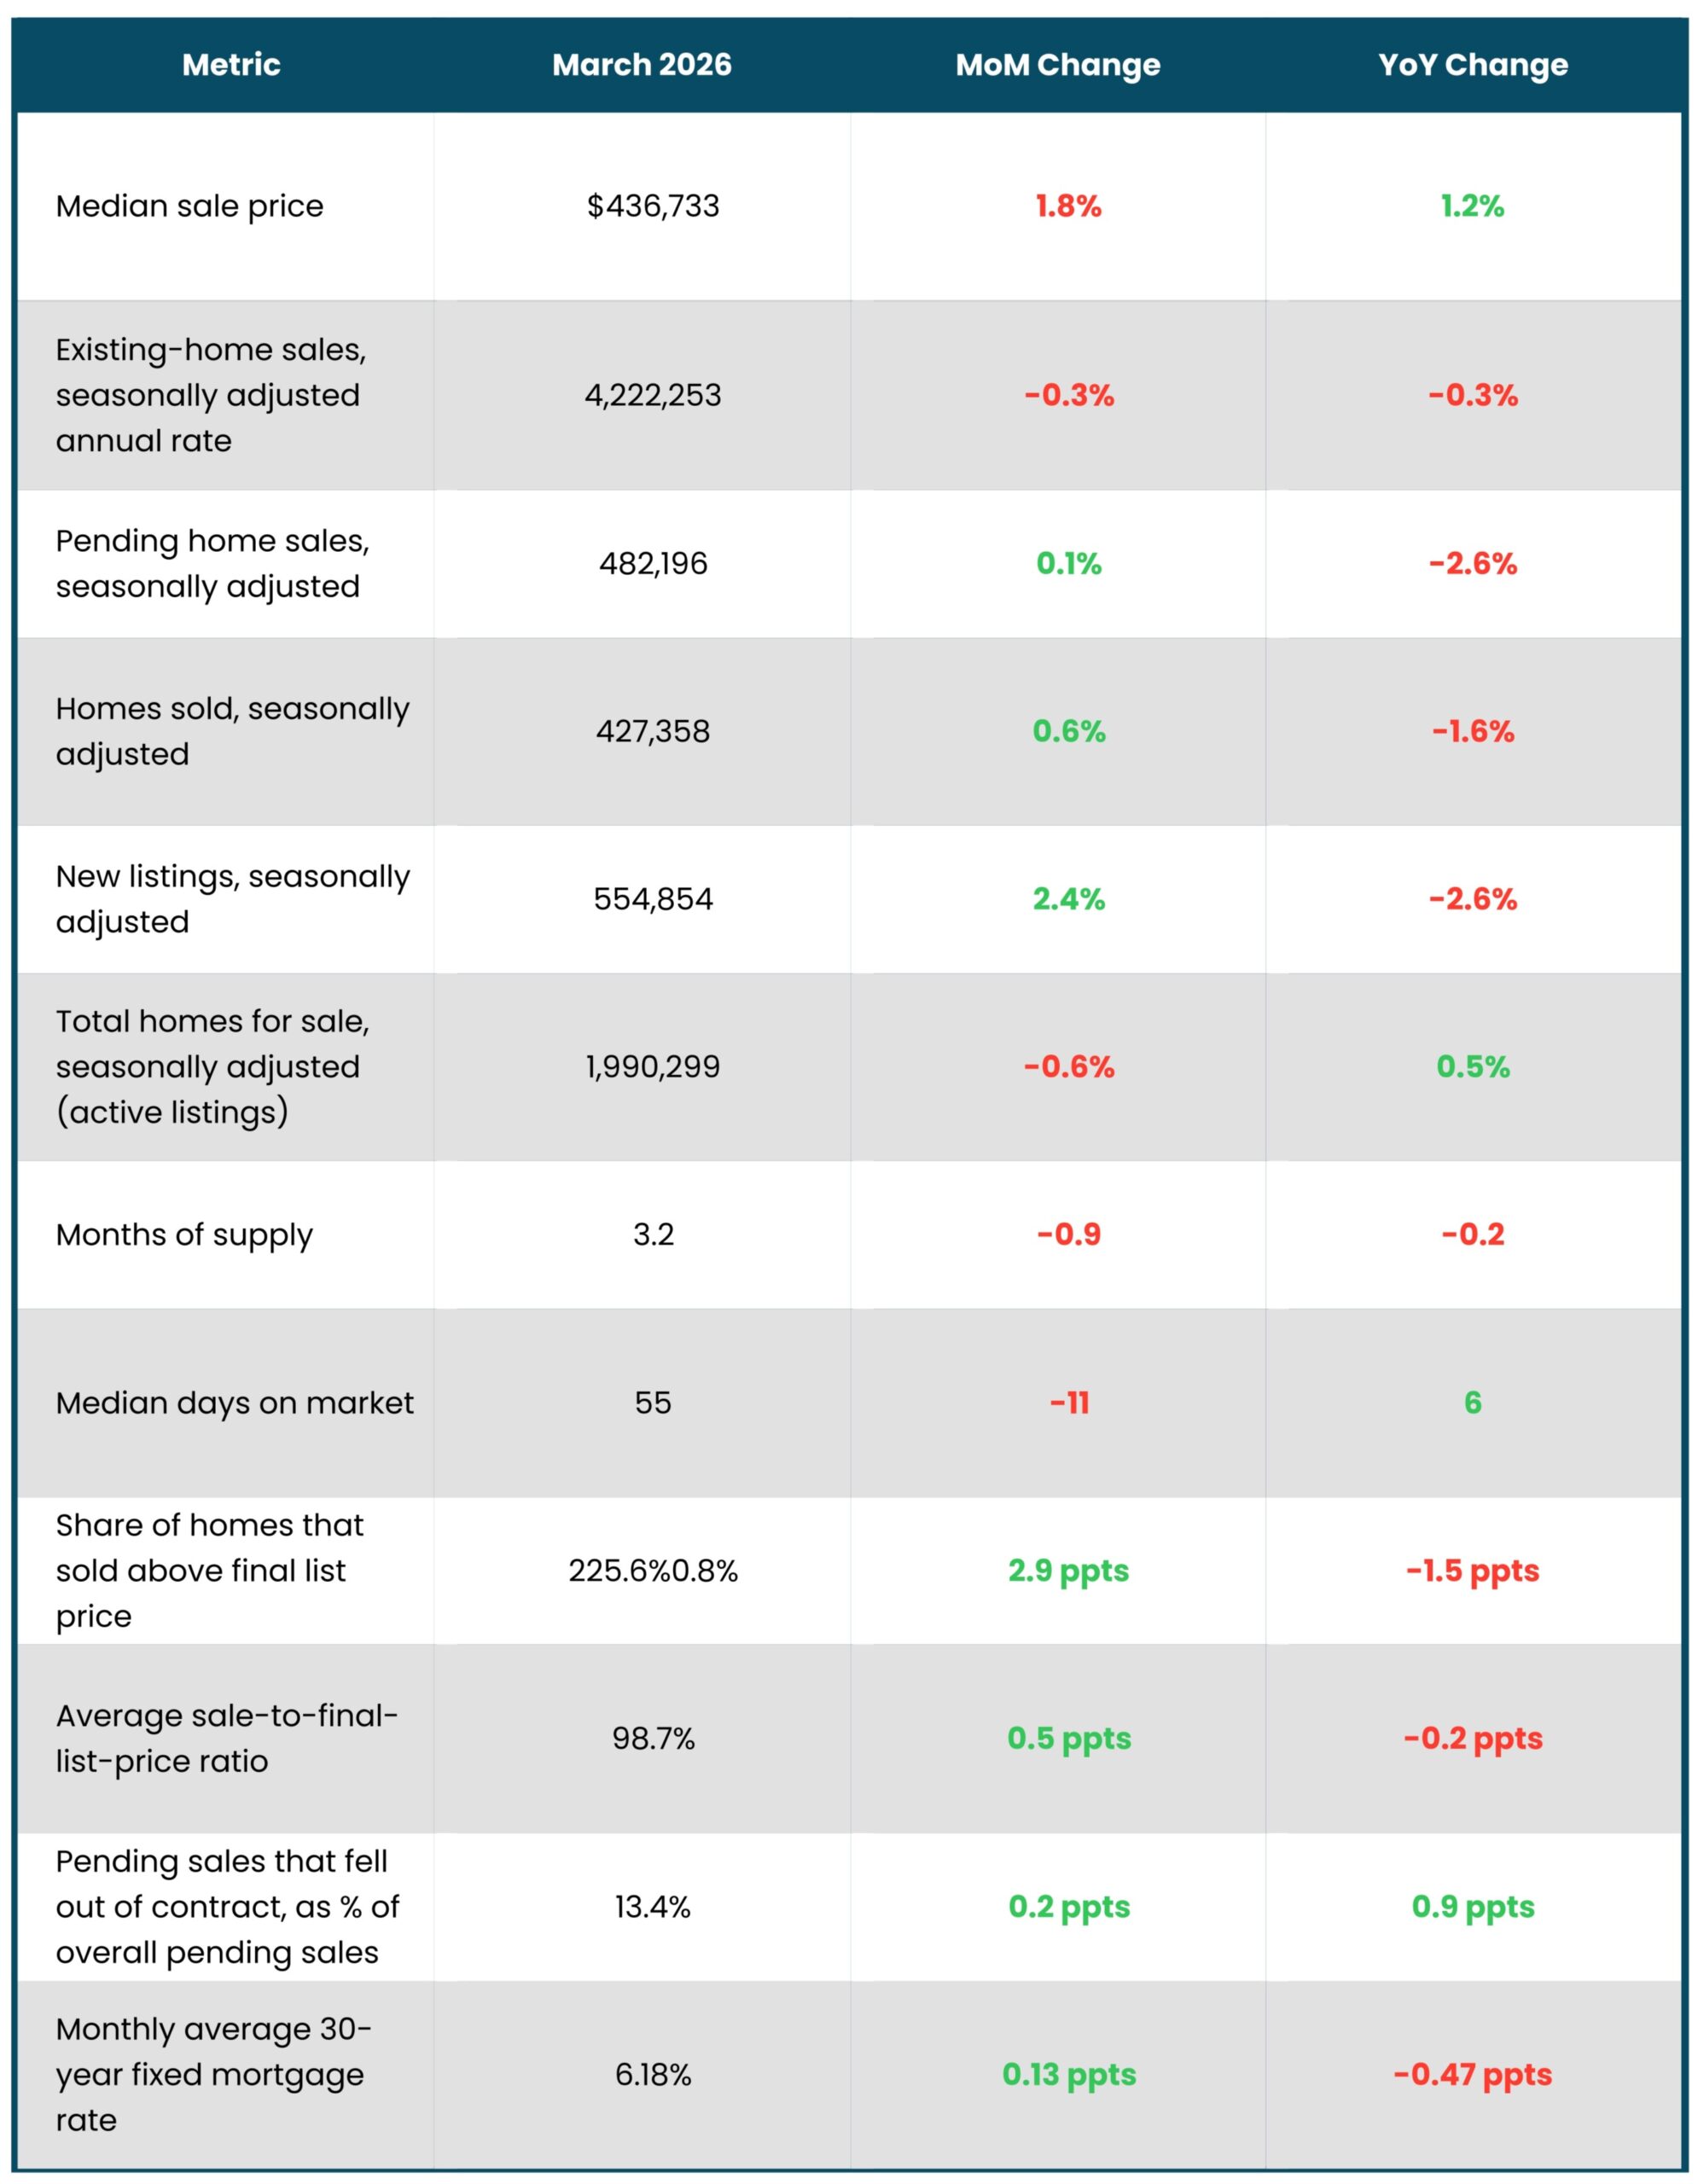
The median home price nationally rose just 1.2% year over year
Active listings declined slightly month over month
Pending sales remained mostly flat
Homes are taking longer to sell, averaging 55 days on market, the slowest pace for March in years
Economic uncertainty, fluctuating mortgage rates, and affordability challenges are keeping many buyers on the sidelines.


Buyers Still Have Leverage in Many Areas
Interestingly, even as prices inch upward nationally, buyers in many markets continue to have negotiating power.
That's because:
Buyer demand has slowed more than seller activity
Homes are sitting longer on the market
Discounts off asking price are becoming more common
This creates a mixed environment where strategy matters more than ever.
What This Means Moving Forward
The housing market is becoming increasingly localized:
High-demand, supply-constrained metros are seeing strong price growth and competition
Most other areas are experiencing a slower, more balanced market
For buyers, this means opportunities still exist—especially outside of the hottest markets.
For sellers, success depends on understanding local demand, pricing strategically, and presenting the home in its best possible condition.
Key Takeaway
The 2026 housing market isn't moving in one direction—it's splitting into two distinct experiences.
In some markets, competition is fierce and prices are rising fast. In others, buyers have more time, more options, and more negotiating power.
Understanding which market you're in is the key to making smart, confident decisions.
March 2026 Housing Market Highlights: United States
Metro-Level Highlights (Year Over Year)
Based on the 50 most populous U.S. metropolitan areas:
Price Growth Leaders
- San Jose, CA: +14.1%
- Detroit, MI: +8.1%
- Milwaukee, WI: +8%
Largest Price Declines
- Tampa, FL: -17.6%
- Dallas, TX: -6.5%
- Sacramento, CA : -3.5%
Pending Sales Increases
- West Palm Beach, FL : +25.4%
- Miami, FL: +12.5%
- Milwaukee, WI: +11.7%
Biggest Pending Sales Declines
- Providence, RI : -12.2%
- New Brunswick, NJ : -12.6%
- New York, NY: -12.6%
Closed Sales Gains
- West Palm Beach, FL: +9.5%
- Kansas City, MO : +7.7%
- Virginia Beach, VA : +6.4%
Closed Sales Declines
- Nassau County, NY : -9.7%
- Pittsburgh, PA : -9%
- Oakland, CA: -7.6%
New Listings Growth
- San Jose, CA: +13.5%
- Boston, MA : +12.3%
- San Francisco, CA: +9.1%
New Listings Declines
- Tampa, FL: -17.6%
- Jacksonville, FL: -13.4%
- Miami, FL : -13.3%
Active Listings Growth
- Seattle, WA: +16.6%
- Boston, MA: +13.5%
- Milwaukee, WI : +10.6%
Active Listings Declines
- Jacksonville, FL : -15%
- Tampa, FL : -13%
- Riverside, CA : -3%
Longest Days on Market
- Nashville, TN : 91 days (+23 days YoY)
- Indianapolis, IN : 69 days
- Austin, TX : 109 days
Shortest Days on Market (Biggest Decreases)
- Kansas City, MO : -3 days
- Houston, TX : -3 days
- San Francisco, CA : -3 days
- West Palm Beach, FL : -3 days