
US Residential Real Estate Market Report - September 2026
Pending Home Sales Sink to Their Lowest Level Since 2014 as Housing Supply Reaches a 6-Year High
The U.S. housing market weakened in September as rising mortgage rates and persistent affordability challenges pushed homebuying demand to its lowest level in more than a decade, excluding the pandemic-related freeze in 2020.
Pending home sales fell 4% month over month to 316,652, marking the largest monthly decline in more than three years. The drop came as mortgage rates climbed above 7% toward the end of September, pricing more potential buyers out of the market.
Meanwhile, housing supply continued to expand. The total number of homes for sale increased 1.2% from August to 1,510,784, reaching its highest level since March 2020.
Home prices continued to rise, but growth slowed considerably. The median U.S. home-sale price increased 1.3% year over year to approximately $394,000, the smallest annual increase since February.
With more homes available and fewer buyers making offers, the market is increasingly favoring buyers who can afford to purchase. However, high borrowing costs remain a significant obstacle for many households.
Homebuying Demand Drops to Its Lowest Level Since 2014
Pending home sales declined 4% month over month in September to 316,652, the lowest level since spring 2014, excluding April 2020, when the pandemic brought much of the housing market to a standstill.
The decline reflects the impact of rising mortgage rates and continued affordability pressures. By the end of September, weekly average mortgage rates had climbed to 7.28%, their highest level in three years.
Higher borrowing costs increase monthly mortgage payments, making homeownership more expensive even for buyers who can afford a property's asking price.
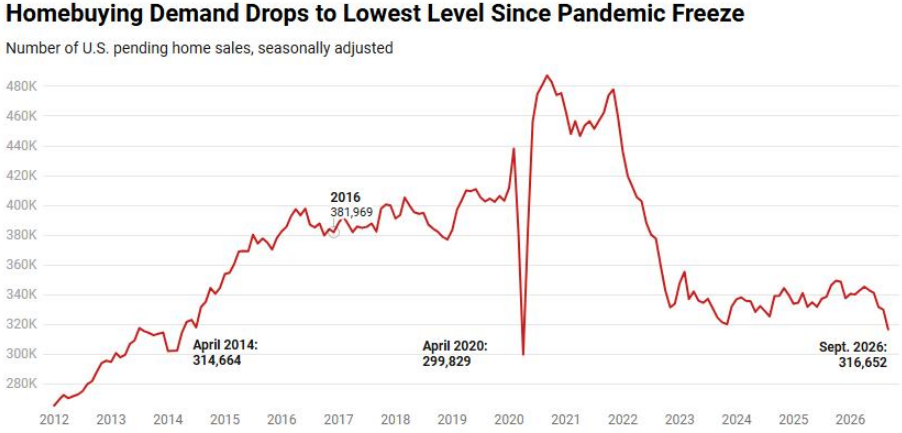
Pending sales declined year over year in all 50 of the most populous U.S. metropolitan areas. The steepest drops were concentrated on the West Coast, where high home prices make buyers particularly sensitive to changes in mortgage rates.
Seattle recorded the largest decline, followed by Los Angeles, San Diego and Anaheim, California.
Seattle's weaker local job market and uncertainty in the technology sector have further discouraged buyers. In Southern California, already-high housing costs have made it increasingly difficult for prospective buyers to qualify for financing.
Closed Home Sales Fall to Their Lowest Level in Almost Three Years
Closed home sales also weakened in September, declining 1.6% month over month to 282,433, the lowest level since the end of 2023.
Although closed sales reflect transactions that were agreed upon in earlier months, the decline illustrates the broader slowdown in housing activity.
Many of the transactions completed in September went under contract in July or August, when mortgage rates were rising and economic uncertainty was causing potential buyers to reconsider their plans.
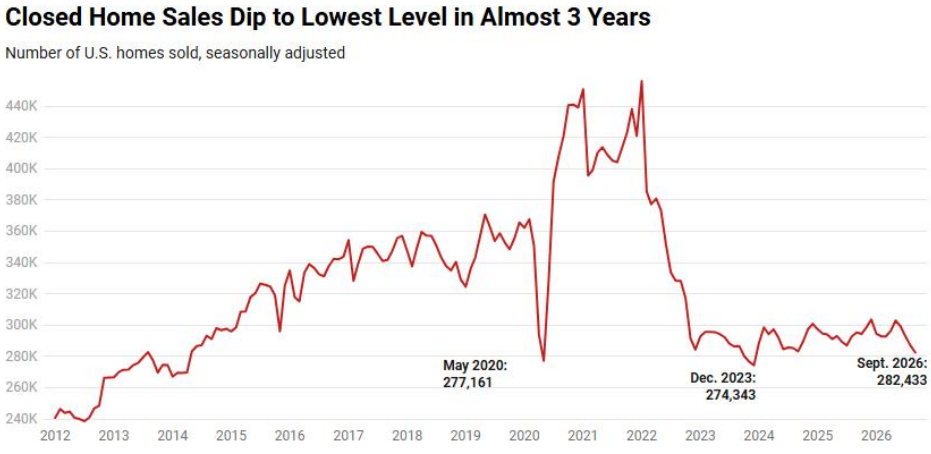
The slowdown was widespread, although some metropolitan areas continued to record year-over-year gains.
Indianapolis, Orlando and Nassau County, New York, posted the strongest increases in closed sales. Philadelphia, Denver and Detroit experienced the largest declines.
The uneven performance highlights how local employment conditions, affordability and housing supply continue to influence individual markets.
Home Prices Are Losing Momentum
National home prices continued to increase in September, but growth slowed compared with earlier in the year.
The median U.S. home-sale price rose 1.3% year over year to $393,985, representing the smallest annual increase since February.
Asking prices are also showing signs of weakening. The median asking price fell 0.5% month over month in September, while its year-over-year increase slowed to 0.6%, the smallest gain since April.
These trends suggest that sellers are facing greater pressure to price their properties competitively as buyers become more selective.
In addition, 60.5% of homes sold in September closed below their original asking price. That continues an extended period in which roughly three in five homes have sold below their initial list price.
Nearly one in five sellers with active listings — 19.8% — reduced their asking price during September. The share of sellers cutting prices increased in 43 of the 50 largest metropolitan areas.
For buyers who remain financially prepared, slower price growth and increased seller flexibility may create opportunities to negotiate more favorable terms.
Housing Supply Reaches Its Highest Level Since 2020
The number of homes available for sale continued to rise in September as sellers brought properties to market while buyer demand weakened.
Total active listings increased 1.2% month over month to 1,510,784, reaching the highest level since March 2020.
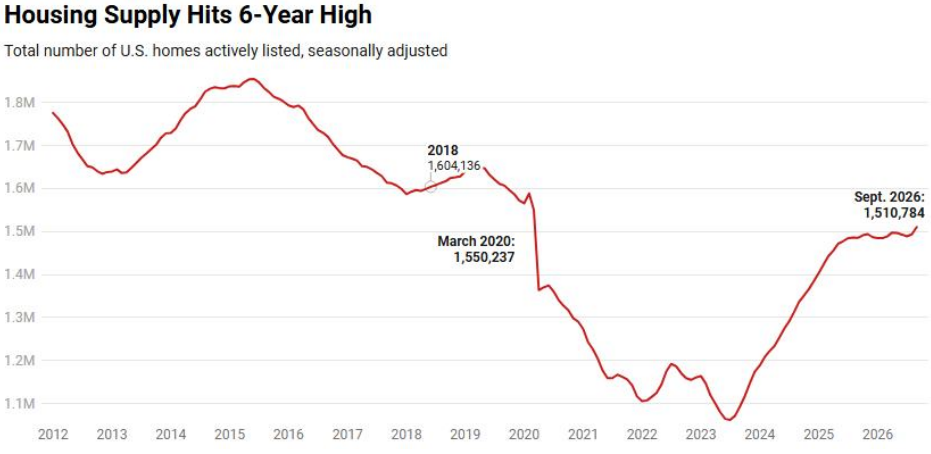
New listings increased slightly by 0.3% from August to 381,191. However, new listings were down 0.4% year over year, indicating that the growing inventory is not being driven by a major annual surge in new properties entering the market.
Instead, the overall supply of homes is expanding partly because properties are not selling as quickly as they once did.
Some homeowners are listing because they need to move, while others remain cautious about current market conditions. With buyers facing higher mortgage payments and more choices, sellers must be increasingly strategic about pricing and presentation.
The growing supply is giving buyers more time to compare properties and reducing the urgency that characterized stronger seller's markets.
Buyers Have More Power as Contract Cancellations Increase
The shift toward a buyer's market is also reflected in the growing number of home-sale agreements that fall through.
In September, 14.5% of pending home sales were canceled, the highest share in the available records outside the extraordinary disruptions of March and April 2020.
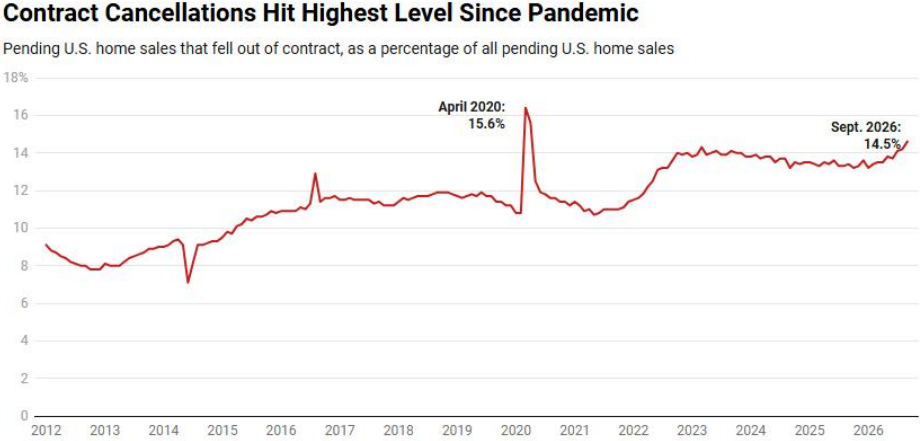
Buyers may walk away for several reasons, including unfavorable inspection results, higher-than-expected monthly payments, financing complications or a change in their financial circumstances.
With more homes available and competition less intense, buyers are also less likely to feel pressured to proceed with a transaction that no longer meets their needs.
Jacksonville recorded the highest share of canceled deals among the largest metropolitan areas, followed by Tampa, Las Vegas, San Antonio and Phoenix.
At the other end of the spectrum, San Francisco had the lowest cancellation rate. Nassau County, New York, San Jose and Montgomery County, Pennsylvania, also recorded relatively low shares of canceled contracts.
These differences reflect the varying balance between supply and demand across the country. In markets where buyers face stronger competition for limited inventory, contracts are less likely to fall through.
What This Means for Buyers and Sellers
The September housing market presents a challenging environment for both buyers and sellers, although the balance of negotiating power is shifting toward buyers.
For buyers, higher mortgage rates remain a major affordability obstacle. However, growing inventory, slower price growth and a greater willingness among sellers to negotiate may provide opportunities to secure better terms.
Buyers may be able to negotiate on purchase prices, repairs and closing costs. In some cases, sellers may also be willing to contribute toward mortgage-rate buydowns.
For sellers, the market requires more realistic pricing and careful preparation. Homes that are overpriced or poorly presented may remain on the market longer, increasing the likelihood of future price reductions.
Pricing competitively from the beginning, addressing visible maintenance issues and offering reasonable concessions can help sellers attract serious buyers.
The market is also becoming increasingly localized. Some metropolitan areas continue to experience stronger demand and limited supply, while others are seeing substantial declines in pending sales and growing inventories.
Understanding local market conditions is therefore essential when deciding when to buy, sell or negotiate.

September 2026 Housing Market Highlights: United States
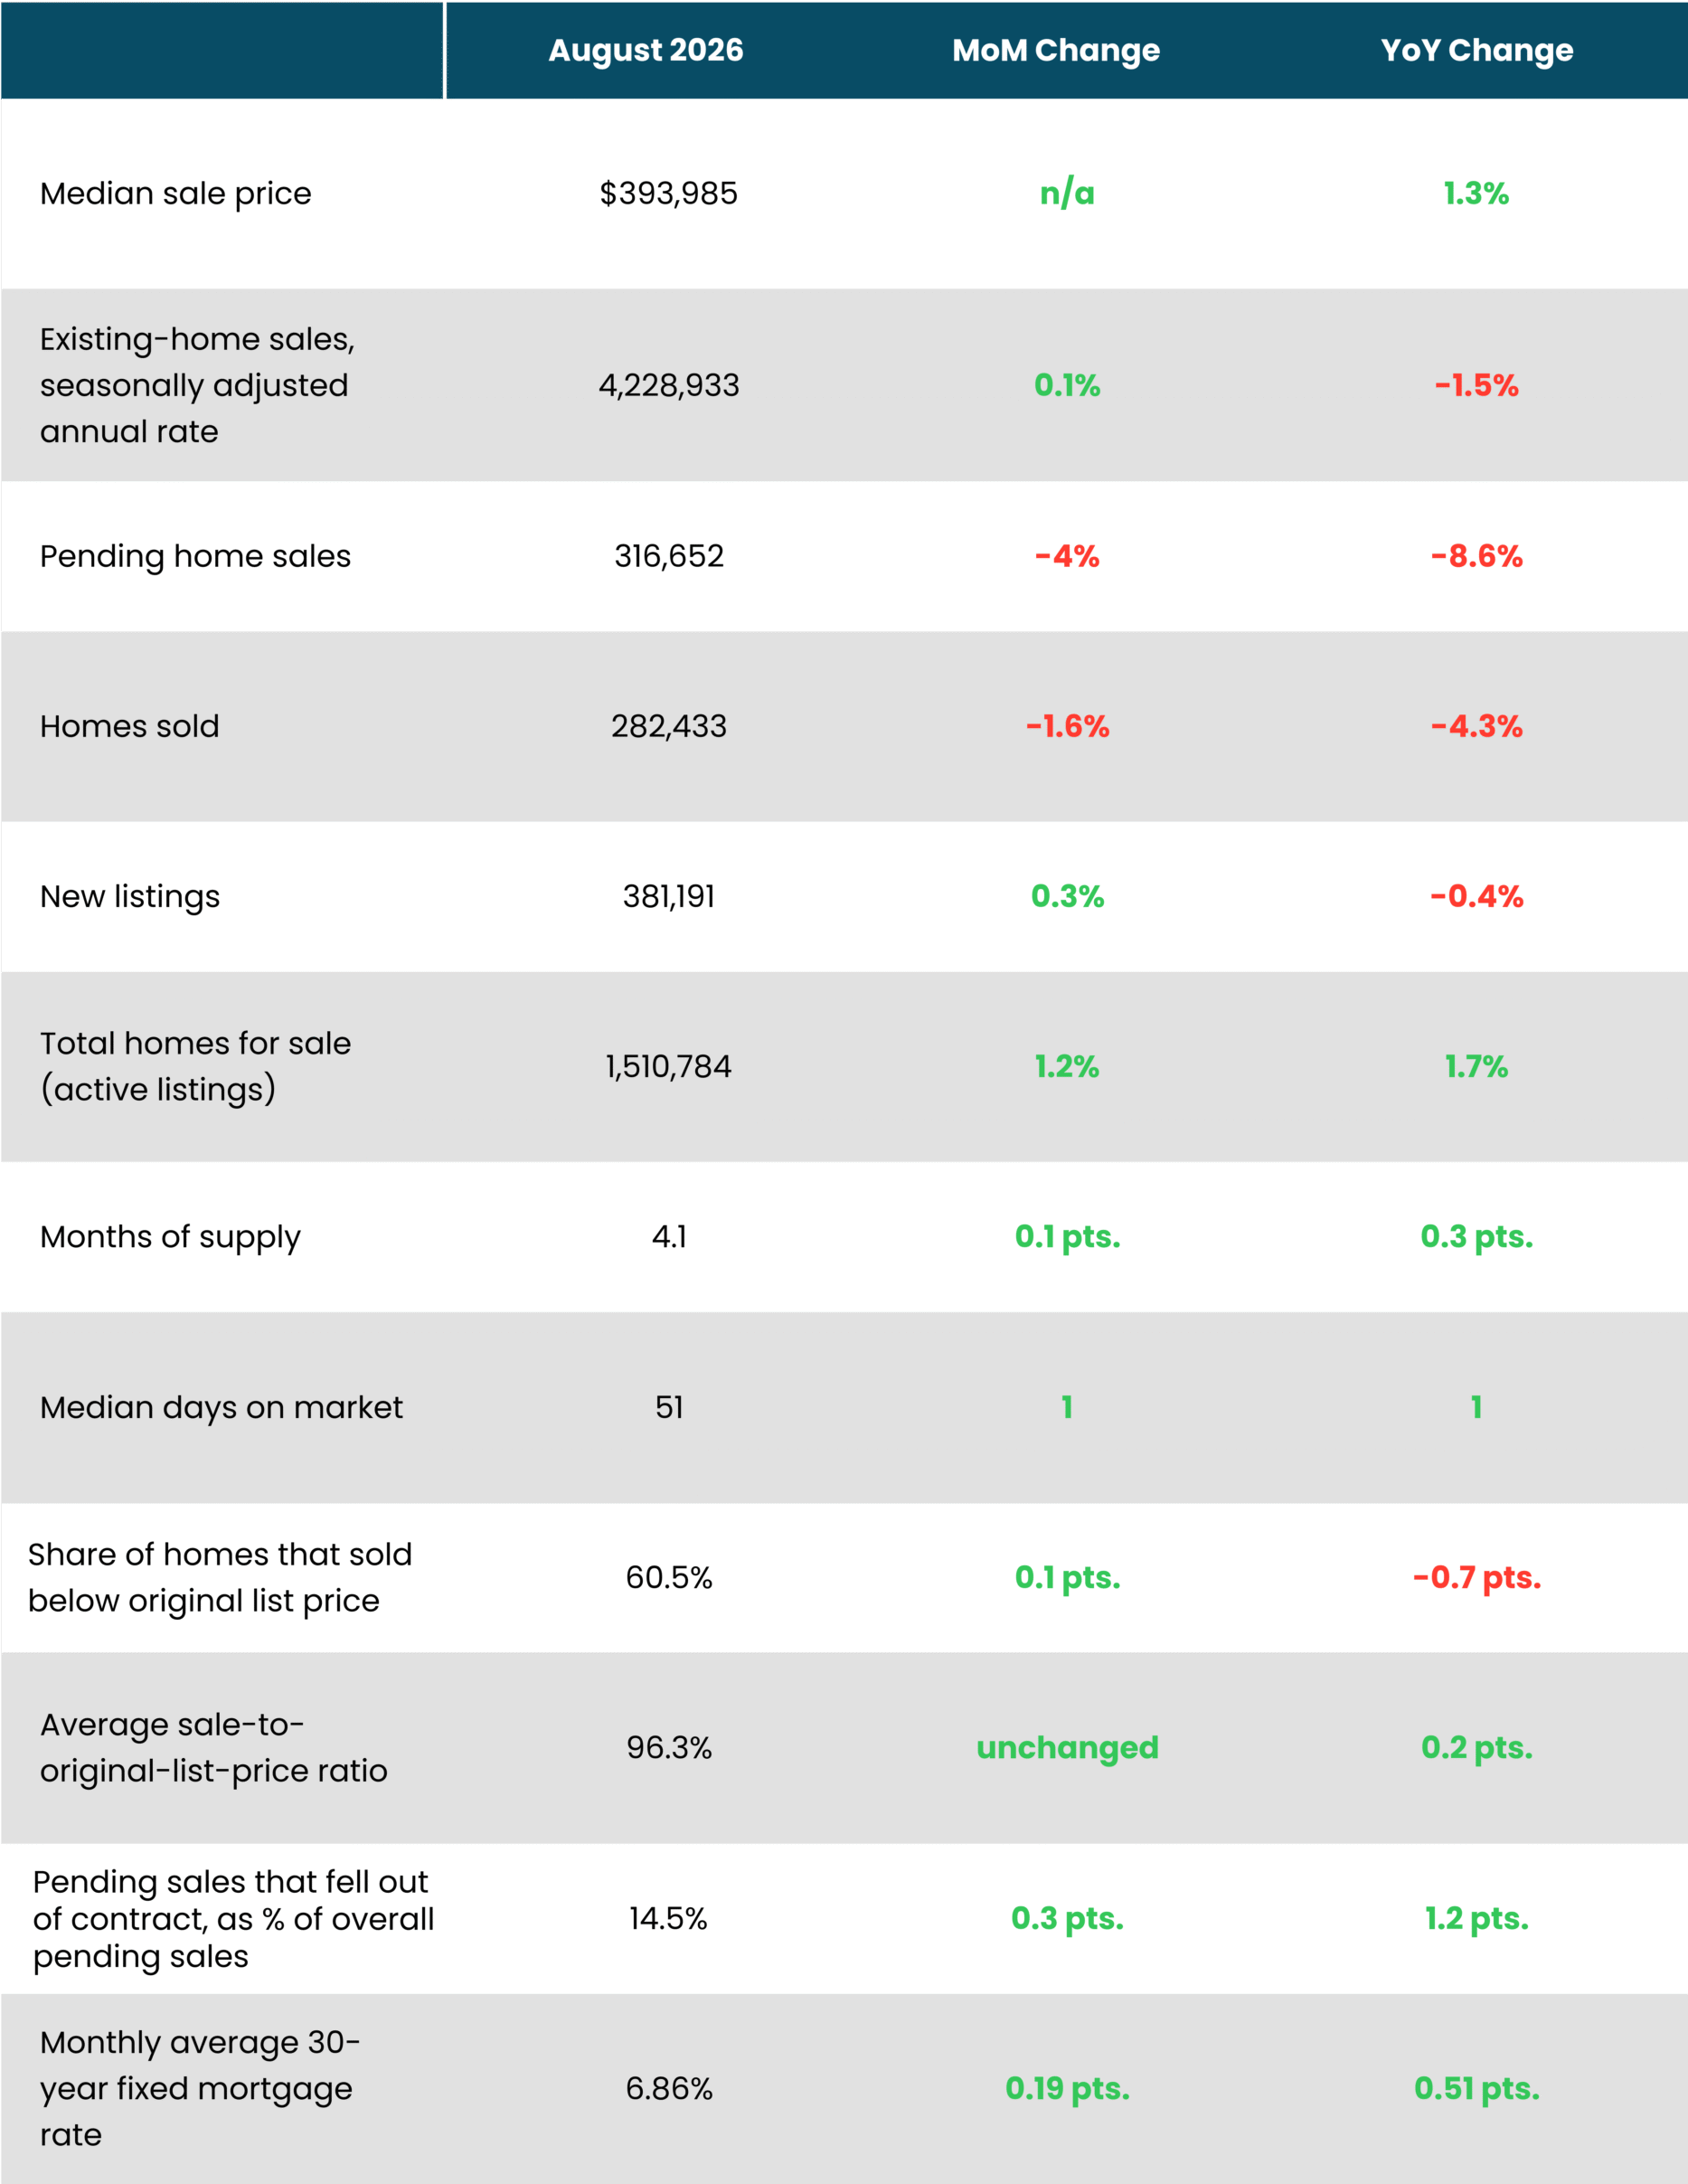
The national housing data shows a market in which buyer demand is weakening while the number of available homes continues to grow.
Pending home sales declined 4% month over month and 8.6% year over year. Closed home sales fell 1.6% from August and 4.3% from a year earlier.
The median sale price increased 1.3% year over year to $393,985, but asking-price growth slowed and more sellers reduced their initial asking prices.
Total homes for sale rose 1.2% month over month and 1.7% year over year to 1,510,784. Housing supply reached 4.1 months, up 0.1 month from August and 0.3 month from the previous year.
The typical home spent 51 days on the market, one day longer than both the previous month and the previous year.
Meanwhile, 60.5% of homes sold below their original list price, and 14.5% of pending transactions fell through.
Overall, the data points to a housing market with weaker demand, expanding inventory and greater negotiating power for buyers, although elevated mortgage rates continue to limit affordability.
September 2026 Metro-Level Highlights
Based on the 50 most populous U.S. metropolitan areas. All changes represent year-over-year changes:
Price Growth Leaders
- San Francisco, CA: +14.6%
- Cleveland, OH: +7.9%
- St. Louis, MO: +6.7%
Largest Price Declines
- Seattle, WA: -4.4%
- San Jose, CA: -3.4%
- Denver, CO: -2.6%
Pending Sales Increases
- Pending sales declined in all 50 major metropolitan areas. No metro recorded year-over-year growth.
Biggest Pending Sales Declines
- Seattle, WA: -24.4%
- Los Angeles, CA: -16.0%
- San Diego, CA: -15.8%
Closed Sales Gains
- Indianapolis, IN: +3.2%
- Orlando, FL: +3.0%
- Nassau County, NY: +2.8%
Closed Sales Declines
- Philadelphia, PA: -13.8%
- Denver, CO: -13.7%
- Detroit, MI: -12.4%
New Listings Growth
- Virginia Beach, VA: +8.4%
- San Jose, CA: +7.9%
- Anaheim, CA: +7.0%
New Listings Declines
- Detroit, MI: -11.3%
- Oakland, CA: -8.4%
- Nassau County, NY: -6.0%
Active Listings Growth
- Seattle, WA: +22.9%
- San Jose, CA: +19.4%
- Boston, MA: +18.3%
Active Listings Declines
- Fort Lauderdale, FL: -14.6%
- Jacksonville, FL: -13.8%
- West Palm Beach, FL: -13.3%
Days on Market — Biggest Increases
- Tampa, FL: +16 days
- Orlando, FL: +12 days
- San Antonio, TX: +8 days
Days on Market — Biggest Decreases
- Fort Lauderdale, FL: -20 days
- West Palm Beach, FL: -14 days
- Jacksonville, FL: -9 days