
US Residential Real Estate Market Report - January 2026
Table of Content
-
Home Prices Start the Year Up Just 1% as Buyer's Market Keeps Growth in Check
-
U.S. Home Prices Rose 1% in January
-
Mortgage Rates Drop to Lowest Level Since 2022
-
Home Sales Sink as Many Buyers Remain Priced Out
-
Sellers Pull Back Amid Sluggish Demand
-
Homes Are Selling at the Slowest January Pace in a Decade
-
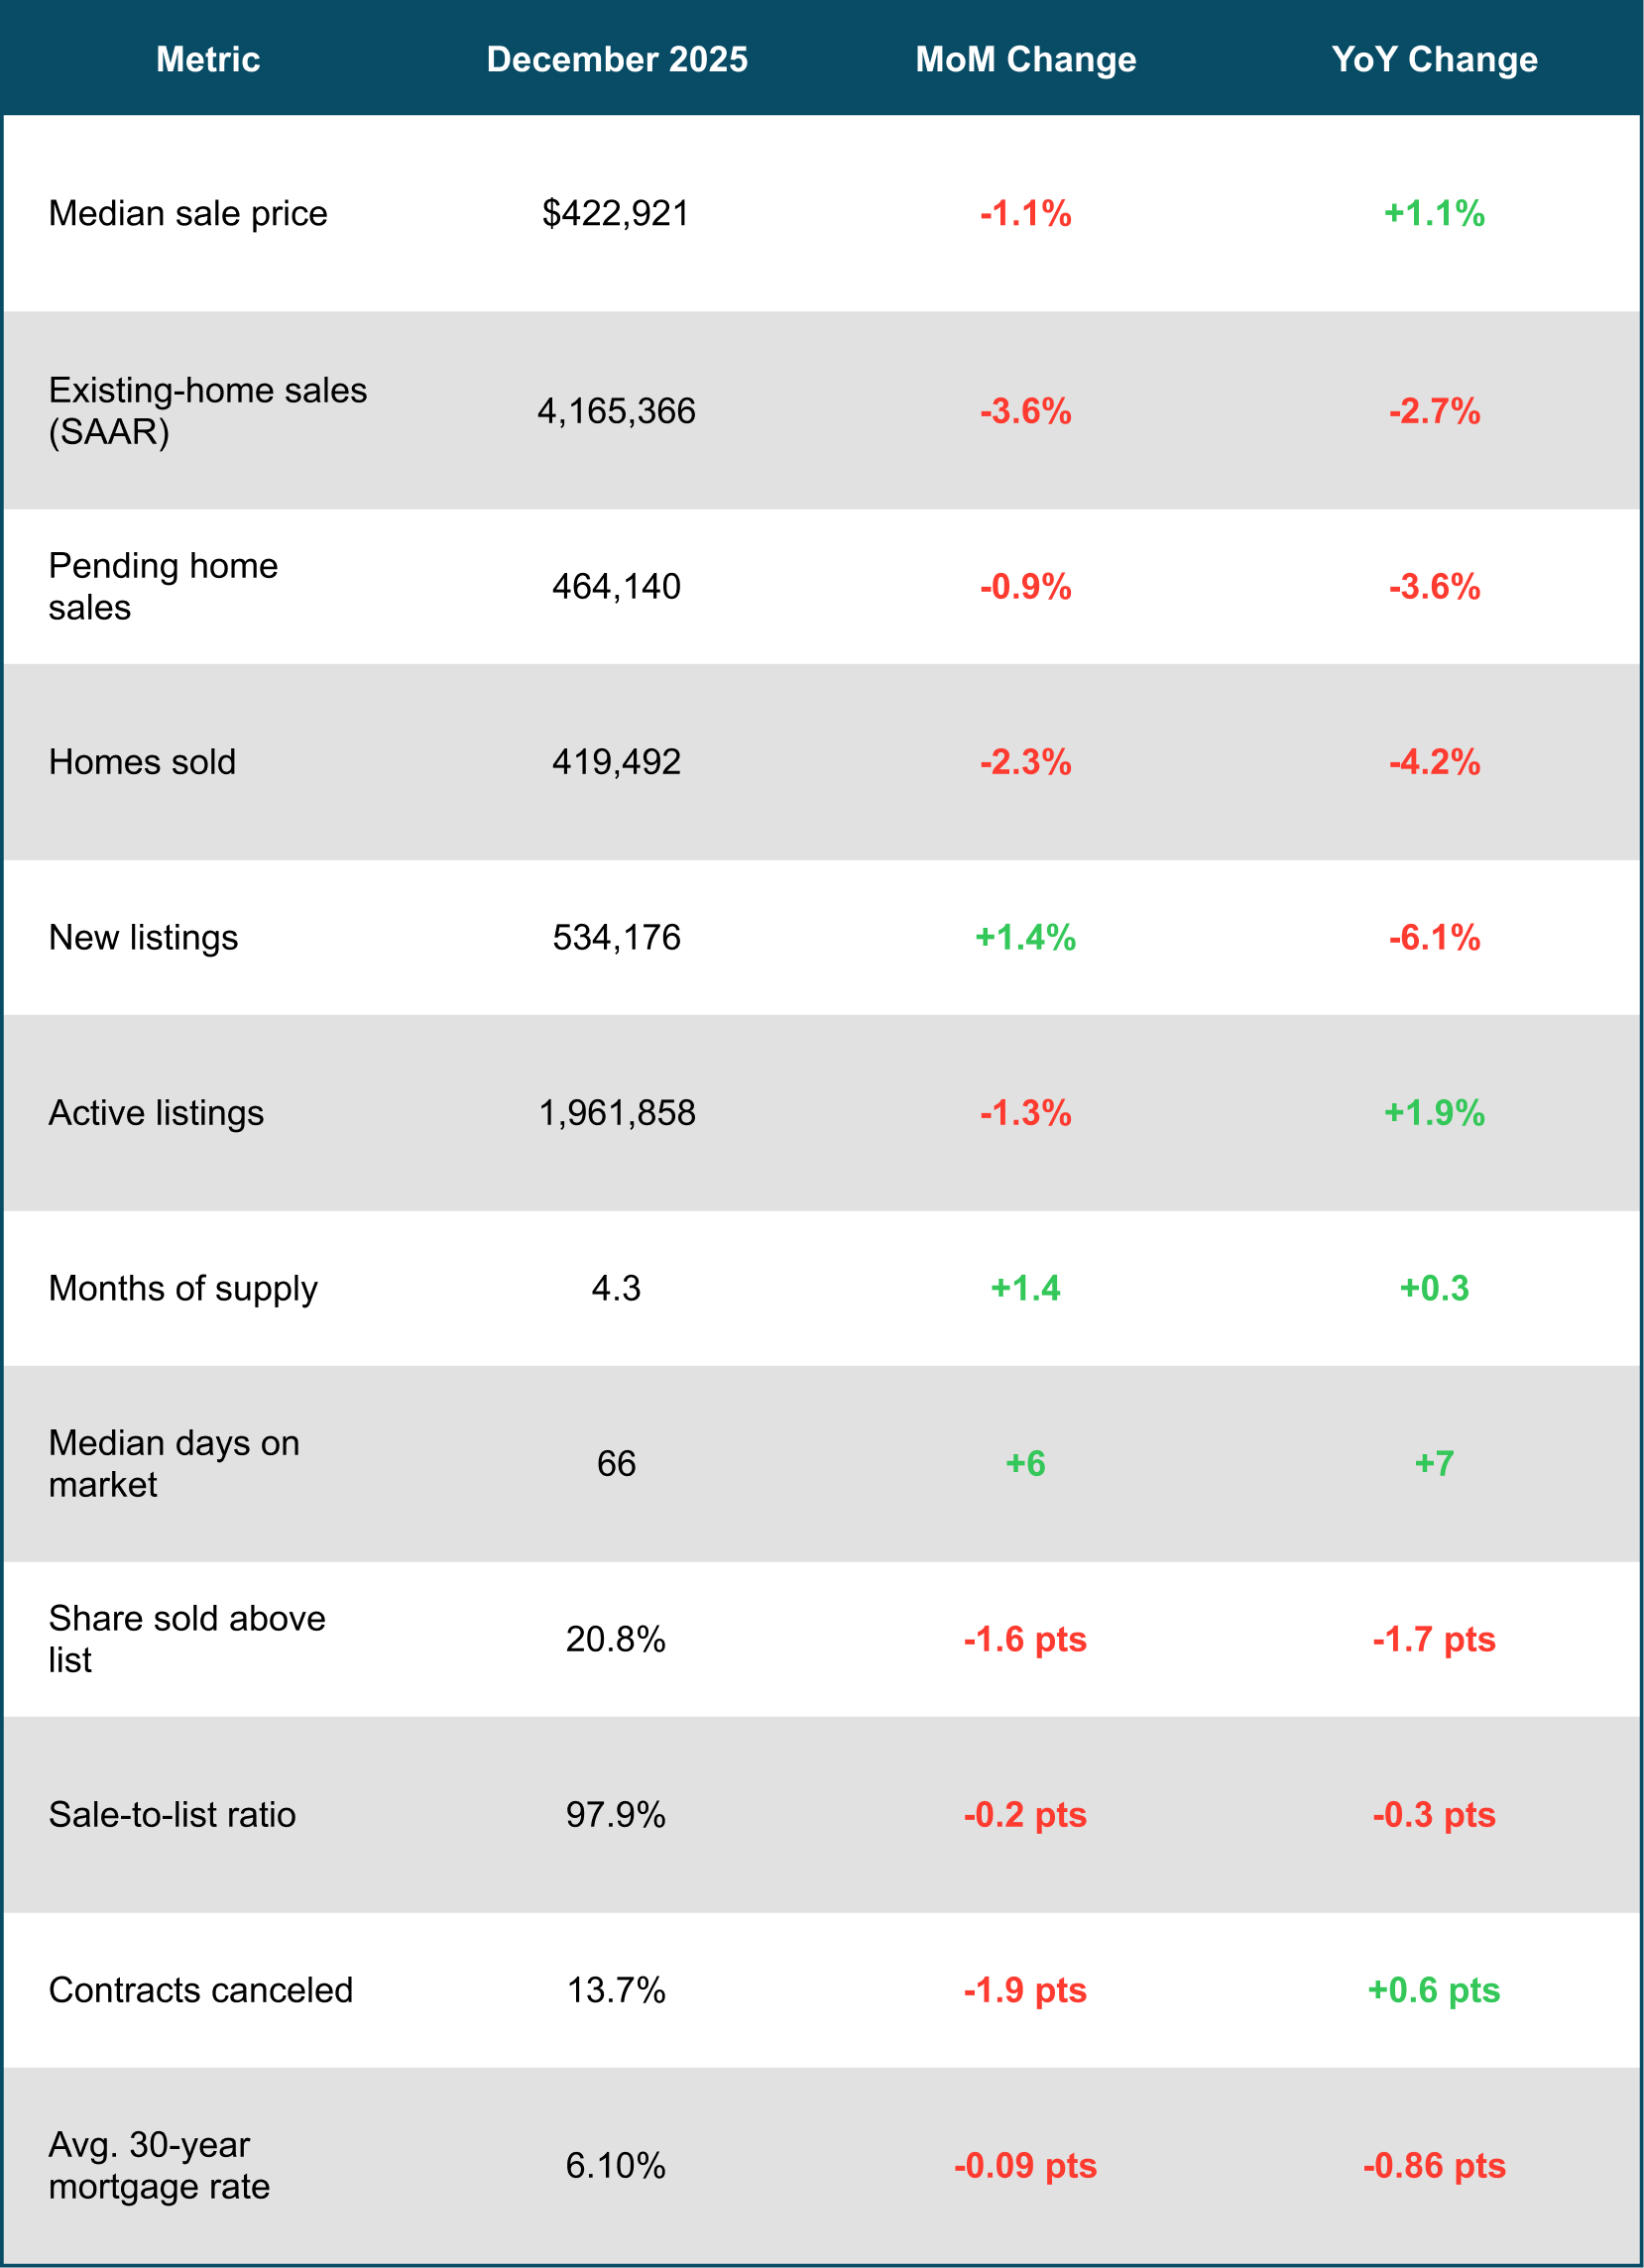
January 2026 Housing Market Snapshot (United States)
-
Metro-Level Highlights (Year Over Year)
-
Download Report as PDF
Home Prices Start the Year Up Just 1% as Buyer's Market Keeps Growth in Check
Pending home sales fell to their lowest level since 2023, and existing-home sales posted their largest monthly drop since 2022 as elevated housing costs continued to curb buyer demand.
While sellers have also pulled back, they still far outnumber buyers. That imbalance has created one of the strongest buyer's markets in recent history, giving active buyers more negotiating power.
The typical home that went under contract in January did so in 66 days — the slowest January pace in a decade.
The median U.S. home sale price rose 1.1% year over year in January to $422,921. Price growth has now hovered below 2% for 10 consecutive months — a sharp contrast to the double-digit gains seen during the pandemic housing boom.
U.S. Home Prices Rose 1% in January
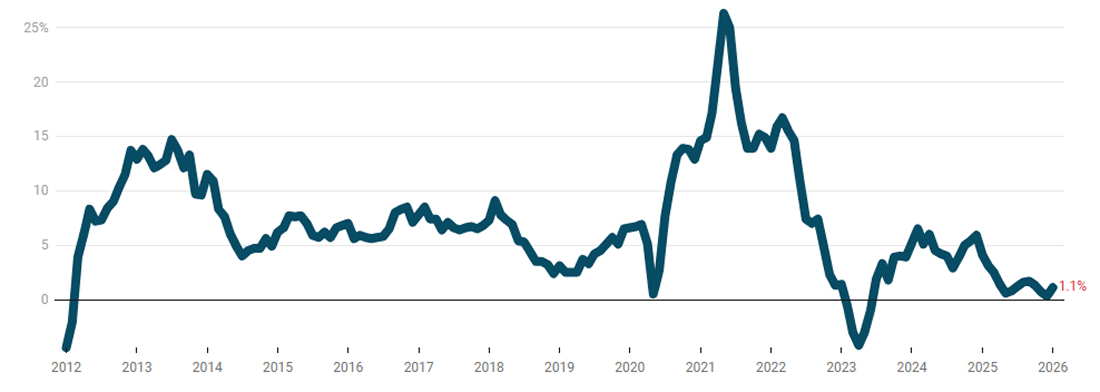
After years of rapid appreciation, home price growth has cooled significantly. Many buyers were priced out during the surge in values over the past few years, and that reduced demand is now tempering price increases.
When sellers outnumber buyers, shoppers typically gain leverage because they have more options. That dynamic defines a buyer's market — though affordability challenges still limit who can participate.
In January:
-
The typical home sold for 2.1% less than its final list price, the largest January discount since 2023.
-
Just 20.8% of homes sold above asking price, the lowest January share since 2020.
Affordability Showing Early Signs of Improvement
Income growth is beginning to outpace home price growth. Wages climbed 3.7% year over year in January — more than triple the increase in home prices.
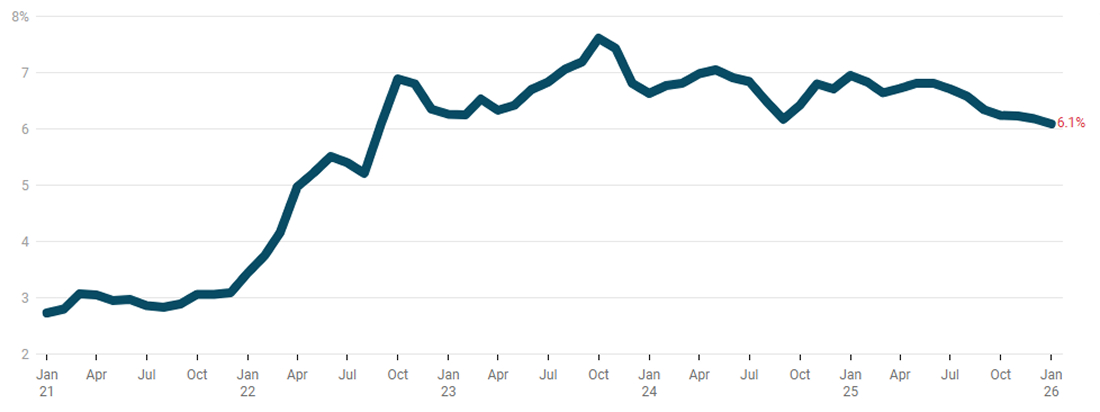
Mortgage rates have also eased somewhat. The average 30-year fixed mortgage rate fell to 6.1% in January, its lowest level since 2022.


Mortgage Rates Drop to Lowest Level Since 2022
Although rates remain well above pandemic-era lows, even modest declines improve purchasing power and monthly affordability.
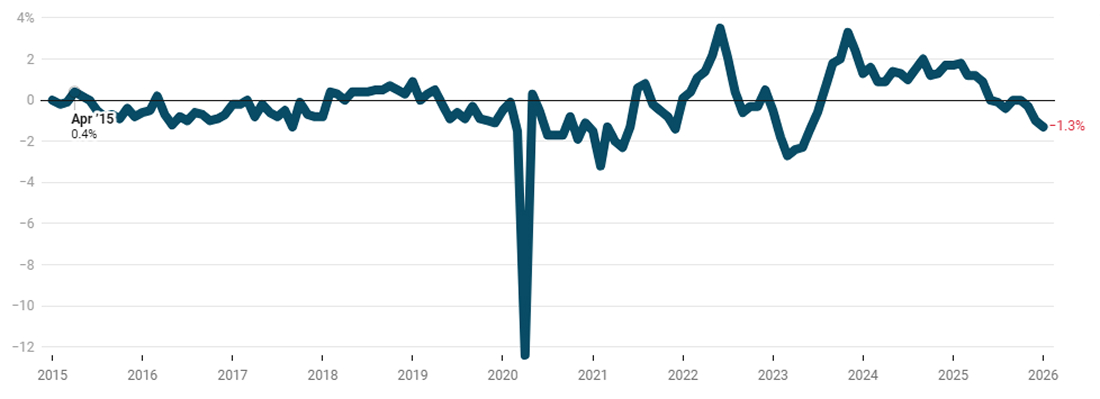
Home Sales Sink as Many Buyers Remain Priced Out
Despite slower price growth and slightly lower mortgage rates, affordability remains strained.
-
The median January sale price reached the highest level ever recorded for that month.
-
Mortgage rates remain more than double the record lows seen during the pandemic.
Many buyers are waiting for rates to decline further before reentering the market.
Sales Activity in January:
-
Pending home sales: Down 0.9% month over month (lowest level since November 2023).
-
Existing-home sales: Down 3.6% month over month — the largest decline since November 2022 — to a seasonally adjusted annual rate of 4.2 million.
-
Overall home sales: Down 2.3% month over month, the biggest drop since December 2022.
Economic uncertainty and affordability concerns have made buyers cautious. Severe winter weather in January may have also dampened activity.
Nearly 40,000 home purchase agreements were canceled in January — equal to 13.7% of homes that went under contract, the highest January cancellation share in records dating back to 2017.
Sellers Pull Back Amid Sluggish Demand
Active listings declined 1.3% month over month — the largest drop since June 2023 — bringing inventory to its lowest seasonally adjusted level in nearly a year.
New listings rose 1.4% from December on a seasonally adjusted basis but were down compared to a year earlier.
Many would-be sellers are also prospective buyers. With high costs still limiting affordability, some are choosing not to sell until conditions improve.
Homes Are Selling at the Slowest January Pace in a Decade
Even though sellers have retreated somewhat, they still outnumber buyers. As a result:
-
The typical home that went under contract in January spent 66 days on the market, up from 59 days a year earlier.
-
This marks the slowest January pace in 10 years.
January 2026 Housing Market Snapshot: United States
Metro-Level Highlights (Year Over Year)
Based on the 50 most populous U.S. metropolitan areas:
Price Growth Leaders
-
Milwaukee: +10.8%
-
Philadelphia: +10%
-
Cleveland: +8.4%
Pending Sales Increases
-
West Palm Beach, FL: +8.2%
-
Columbus, OH: +4.9%
-
Jacksonville, FL: +4.6%
Closed Sales Gains
-
Virginia Beach, VA: +10.4%
-
Kansas City, MO: +2.3%
-
Pittsburgh: +1.6%
Highest Share Selling Above List Price
-
Newark, NJ: 52.9%
-
San Jose, CA: 47.7%
-
Nassau County, NY: 46.4%
Largest Price Declines
-
San Jose, CA: -5.6%
-
Portland, OR: -3.6%
-
Fort Lauderdale, FL: -2.7%
Biggest Pending Sales Declines
-
San Francisco: -21.5%
-
Oakland, CA: -21.3%
-
San Jose, CA: 19.2%
Longest Days on Market
-
San Antonio: 105 days (+21 days YoY)
-
Houston: +19 days
-
Las Vegas: +18 days
Lowest Share Selling Above List Price
-
West Palm Beach, FL: 5.6%
-
Fort Lauderdale, FL: 6.2%
-
Miami: 7.7%