
US Residential Real Estate Market Report - October 2025
Table of Content
-
The U.S. Housing Market Is Stuck, With Sales and Listings Barely Budging
-
Housing Activity Is Flattening Out
-
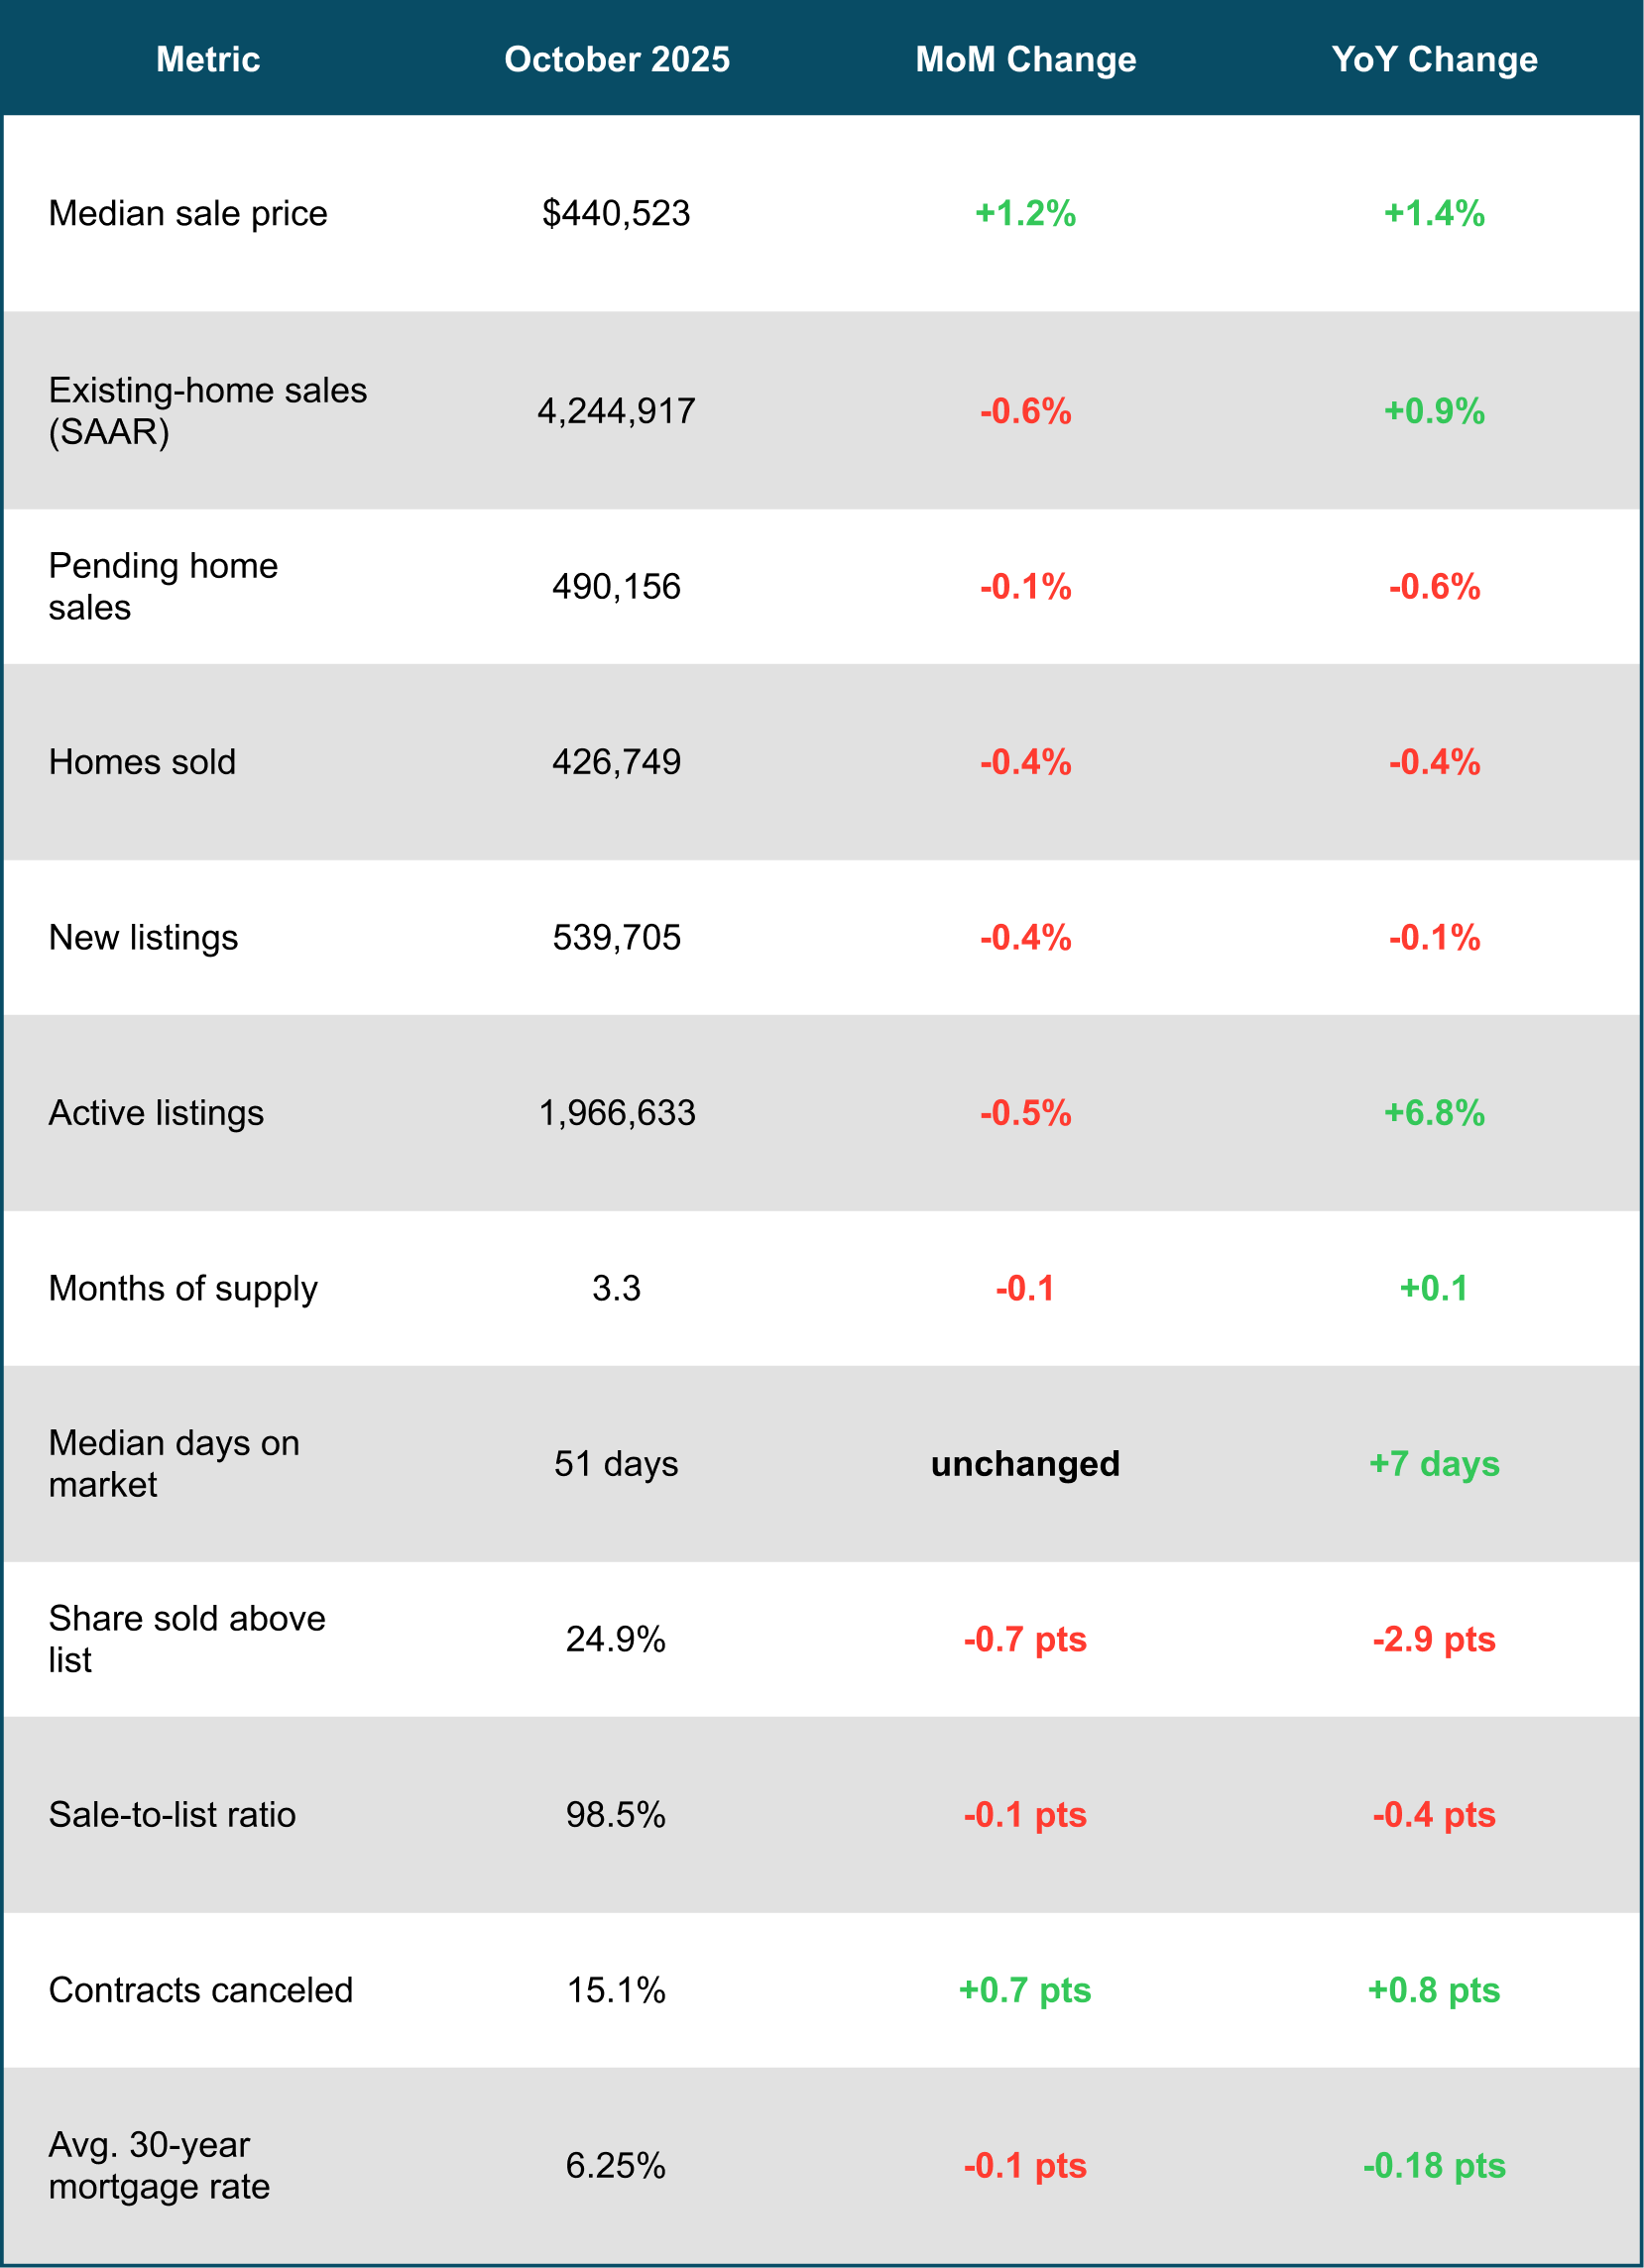
October 2025 U.S. Housing Market Snapshot
-
Buyers Are Securing Bigger-Than-Normal Discounts
-
Metro-Level Market Highlights (Year-over-Year, October 2025)
-
Download Report as PDF
The U.S. Housing Market Is Stuck, With Sales and Listings Barely Budging
Housing activity across the U.S. showed little movement in October, with home sales, new listings, and prices all hovering near the same levels seen a month and a year earlier. After several years of dramatic swings, the market appears to be settling into a period of stagnation as Americans struggle with high housing costs and ongoing economic uncertainty.
Despite sluggish activity, buyers hold the upper hand in many areas. In October, the typical home sold for about 1.5% below its final asking price—the largest October discount seen since 2019. This kind of leverage reflects the imbalance between supply and demand: there are more sellers in the market than active buyers.
However, the national plateau masks significant regional differences. For example, San Francisco is experiencing rising demand and falling inventory, running counter to national trends.
Housing Activity Is Flattening Out
Multiple key indicators pointed to a leveling market in October:
-
Pending sales, closed sales, and new listings were nearly unchanged compared with both September and October of last year.
-
Home price growth also showed signs of slowing. The median sale price rose 1.4% year over year to $440,523, a modest increase compared with the volatile leaps seen from 2020 to 2024 and the stronger gains earlier in 2025.
Existing-home sales followed the same pattern. October's seasonally adjusted annual rate came in at 4.24 million, barely shifted from the previous month or the same period last year. Many economists expect existing-home sales to end the year at levels similar to 2024—which was the slowest year for sales since the mid-1990s.
The last twelve months demonstrate just how stagnant the market has become. The range between the lowest and highest monthly pending-sales readings was the narrowest since 2013, and similar patterns appeared in listing activity and home prices.
According to industry analysts, many would-be buyers and sellers remain frozen by high prices, elevated mortgage rates, and a lack of economic clarity. While both buying and selling activity have cooled, the number of homeowners listing their properties still outpaces the number of shoppers, giving active buyers the ability to negotiate for better terms.
Overall, the market is estimated to have hundreds of thousands more sellers than buyers, and many of today's sellers are people who must move due to job changes, divorces, or other major life events.


October 2025 U.S. Housing Market Snapshot
Buyers Are Securing Bigger-Than-Normal Discounts
October offered unusually strong negotiating power for buyers. The typical home sold for 1.5% below the final list price, marking the largest October discount in six years. Only about one-quarter of homes sold above asking price—the smallest share for any October since 2019.
Homes are lingering longer, too. Properties that went under contract in October spent a median of 51 days on the market, a full week longer than last year and the slowest pace for October since 2016.
Several forces are contributing to longer market times:
-
Seller expectations often exceed what buyers can pay. Many sellers purchased at peak pandemic prices and want to recoup their investment.
-
Buyers remain budget-constrained. Mortgage rates are more than double what they were during the pandemic-era lows.
-
Though rates have eased slightly, many buyers are waiting for further drops before re-entering the market.
Metro-Level Market Highlights (Year-over-Year, October 2025)
Prices:
Biggest increases: Cleveland (+11.6%), Newark (+10.9%), Detroit (+10.4%)
Biggest declines: Jacksonville (-4%), Dallas (-3.6%), Atlanta (-2.5%)
All three major Bay Area metros (San Jose, San Francisco, Oakland) posted price declines.
Pending Sales:
Largest gains: West Palm Beach (+21.6%), Tampa (+18.4%), San Francisco (+12%)
Largest drops: Seattle (-15.6%), Minneapolis (-9.8%), San Antonio (-9.4%)
Some Florida increases may reflect recovery from last year's hurricane disruptions.
Closed Sales:
Highest increases: San Francisco (+16.1%), Tampa (+9.5%), West Palm Beach (+6.9%)
Largest decreases: San Antonio (-16.1%), Las Vegas (-10.3%), Philadelphia (-9.6%)
New Listings:
Biggest increases: Tampa (+15.9%), West Palm Beach (+12.3%), St. Louis (+8.5%)
Biggest decreases: San Jose (-12.1%), Jacksonville (-10.4%), Dallas (-8.8%)
Active Listings:
Largest gains: Washington, D.C. (+19.3%), Las Vegas (+16.9%), Baltimore (+16.1%)
Listings declined in only six metros, led by San Francisco (-12.7%), San Jose (-10.8%), and Chicago (-2.9%)
Homes Sold Above List Price:
Highest shares: San Francisco (58.5%), Newark (58%), San Jose (54%)
Lowest shares: West Palm Beach (5.7%), Fort Lauderdale (6.8%), Miami (7.1%)
Days on Market:
Biggest increases: Miami (+27 days), Fort Lauderdale (+22 days), Austin (+18 days)
Declines seen only in Kansas City (-5 days) and San Francisco (-2 days)