
US Residential Real Estate Market Report - August 2025
Table of Content
-
Housing Supply Drops Most in 2 Years as Sluggish Demand Spooks Sellers
-
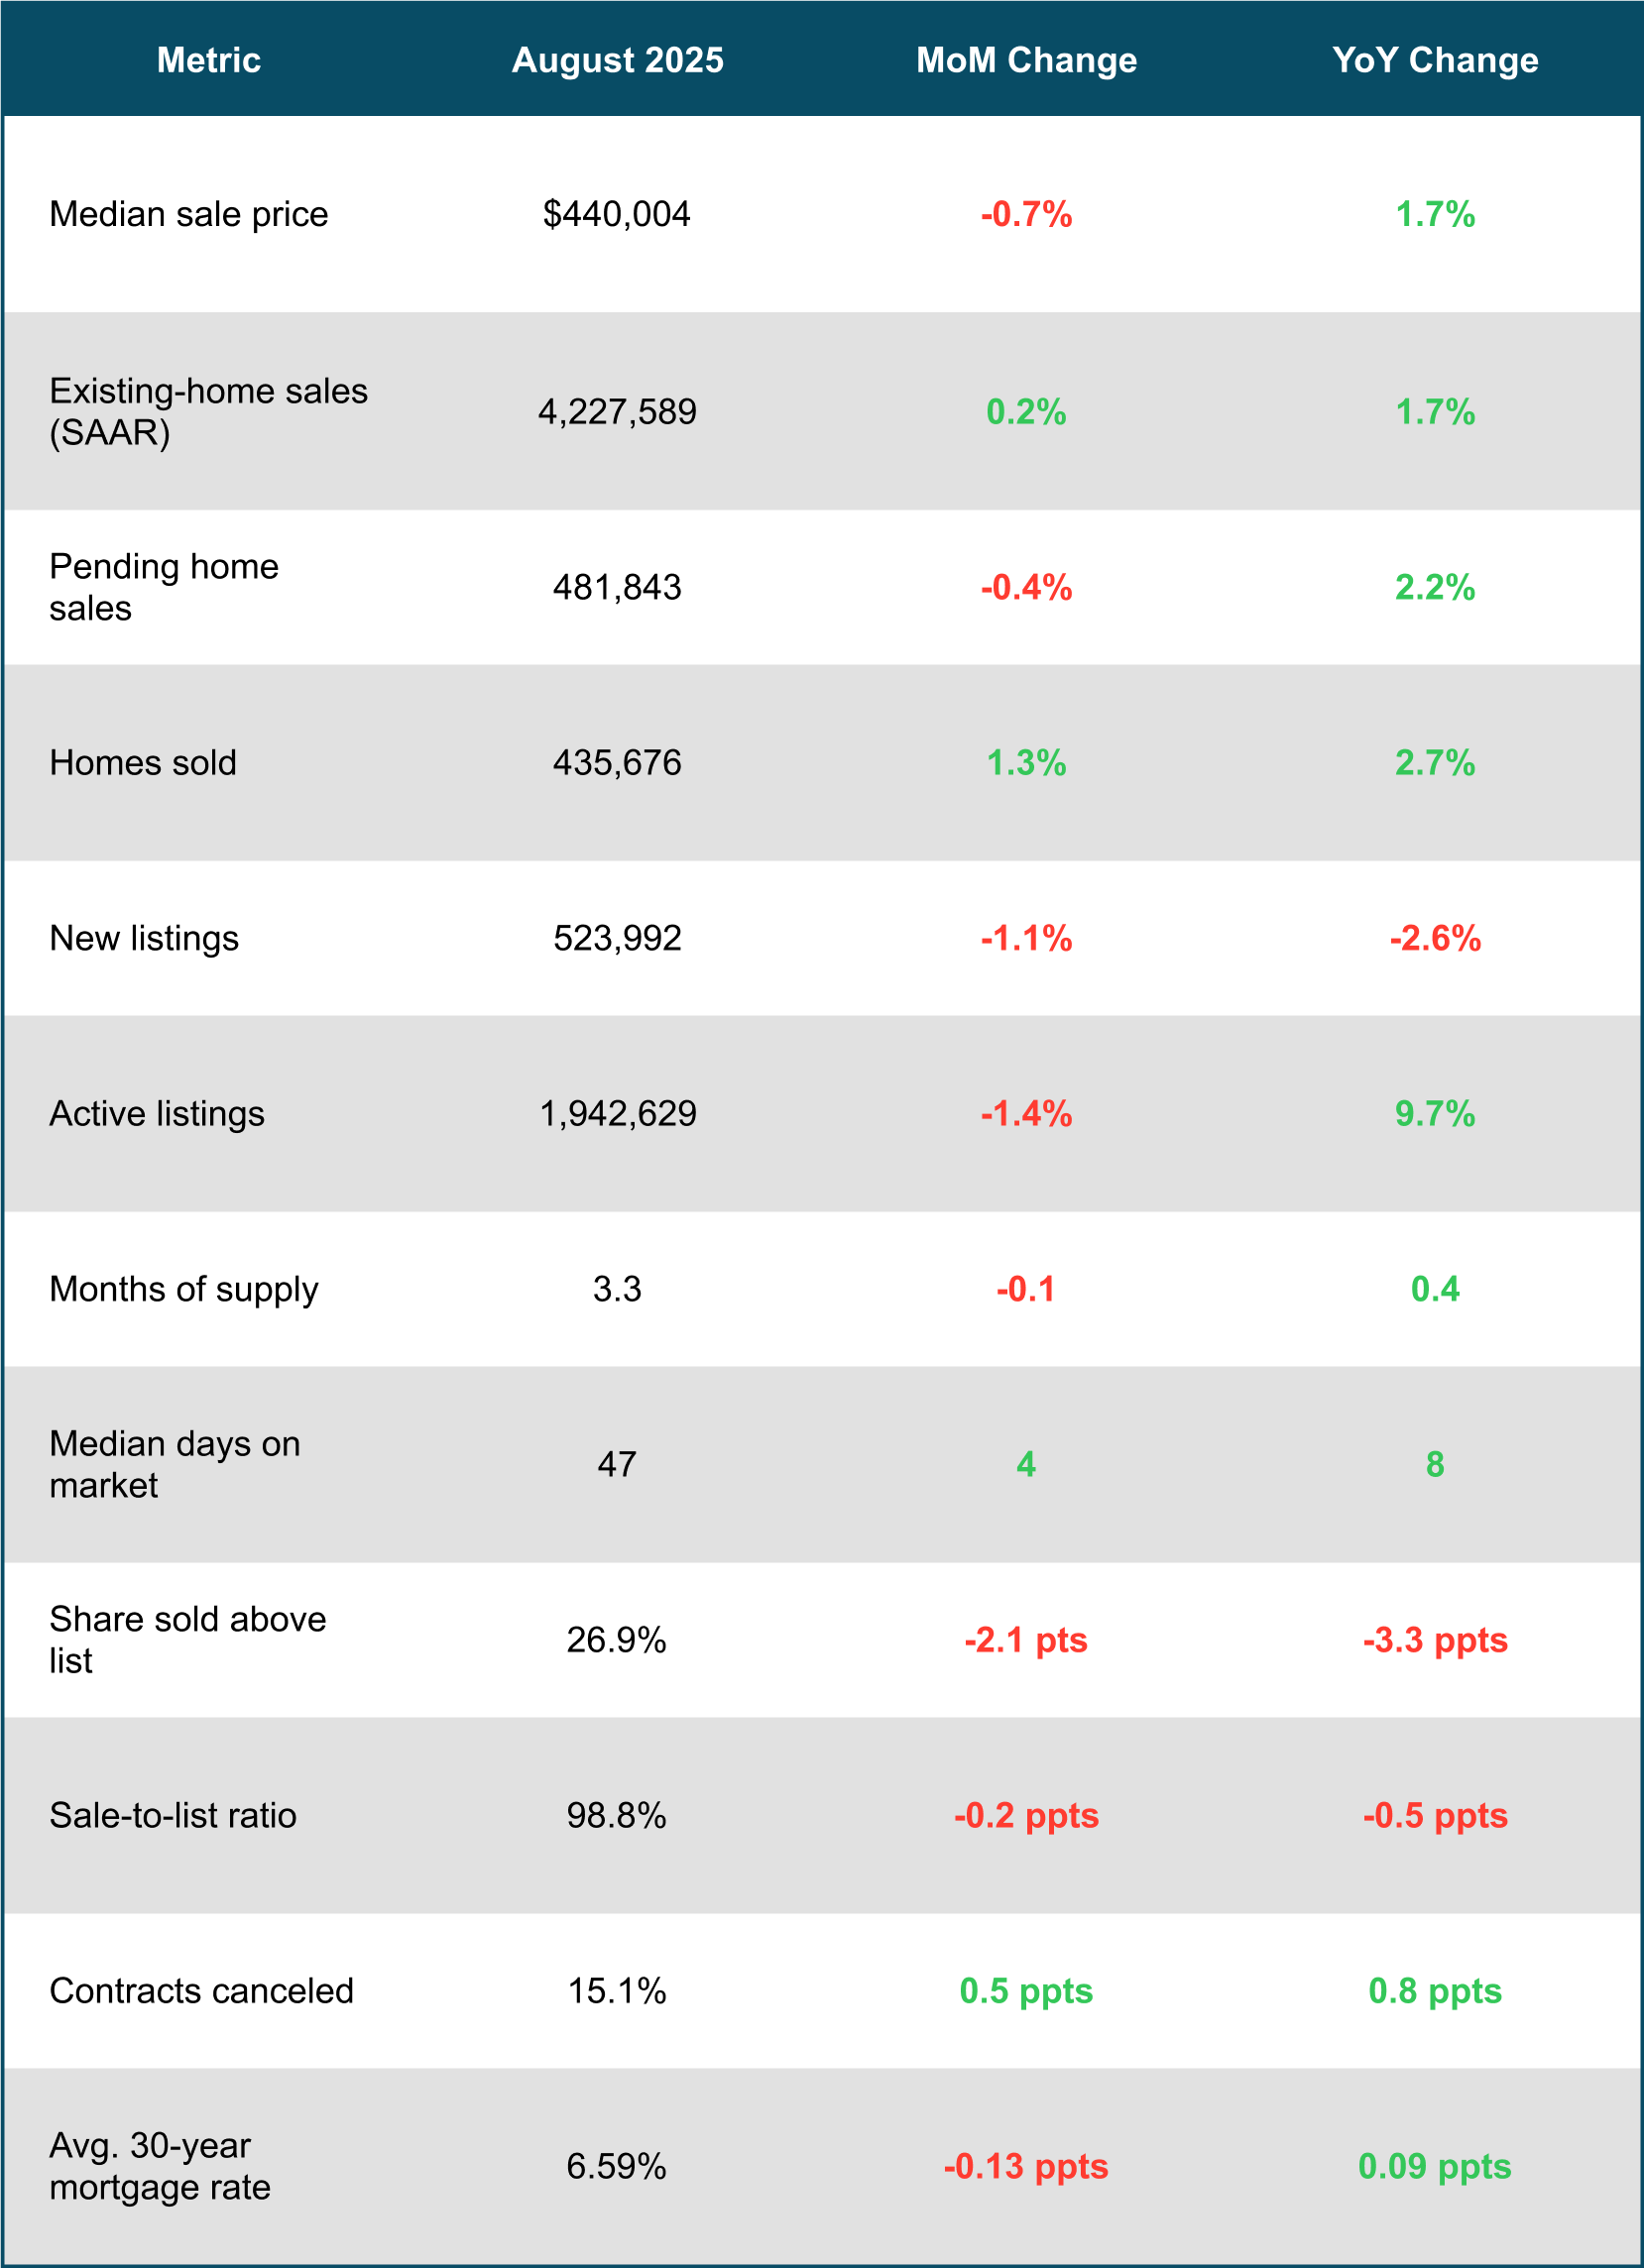
August 2025 Housing Market Highlights: United States
-
Home Prices Rise Most in Five Months as Sellers Retreat
-
Homebuyer Competition Remains Sparse as Sellers Far Outnumber Buyers
-
August 2025 Metro-Level Highlights
-
Download Report as PDF
Housing Supply Drops Most in 2 Years as Sluggish Demand Spooks Sellers
Active listings fell 1.4% in August—the biggest decline since 2023—as homebuying anxiety spilled over to sellers. Mortgage rates dropped to the lowest level in about a year, which has led to an increase in refinancing activity but hasn't yet translated into a jump in sales.
Existing-home sales are expected to end 2025 roughly in line with 2024, which was the slowest year since 1995—but the outlook could improve if rates fall further. Home prices rose 1.7% year over year in August, the biggest uptick in five months.
Active listings of homes for sale fell 1.4% month over month in August—the largest seasonally adjusted decline since June 2023. They rose 9.7% from a year earlier—the smallest year-over-year increase since March 2024.
New listings also cooled, falling 1.1% month over month to the lowest seasonally adjusted level since January 2024 and declining 2.6% year over year.
Sellers have been pulling back because homebuyer demand is sluggish, with sales still far below pre-pandemic levels. Pending home sales and existing home sales were both little changed in August, with pending sales falling 0.4% from a month earlier on a seasonally adjusted basis and existing home sales rising 0.2% to a seasonally adjusted annual rate of 4,227,589.
One housing economist noted:
“High housing costs and economic jitters have rattled buyers, and that unease has spilled over to sellers. We currently expect existing-home sales to end the year at around 4.05 million, or roughly flat compared to 2024, which was the worst year for sales since 1995. The good news is mortgage rates have been falling, giving homebuyers more purchasing power. We have yet to see that translate into a significant bump in sales, but that may change if rates continue declining.”
The average 30-year-fixed mortgage rate fell to 6.59% in August—the lowest monthly average in 10 months. Rates have since fallen further, last week dropping to 6.26%—the lowest level in roughly a year. That has triggered a rise in refinancing activity among existing homeowners, but many prospective homebuyers are still waiting in hopes that rates fall further. The Federal Reserve cut its benchmark interest rate last week, but that was already priced into mortgage rates.
One real estate agent observed:
“I think the magic number is 6%. Prospective homebuyers are paying attention to mortgage rates, and if they drop to 6%, I think we'll see a flood of interest.”


August 2025 Housing Market Highlights: United States
Home Prices Rise Most in Five Months as Sellers Retreat
The median home sale price rose 1.7% year over year in August to $440,004—the biggest uptick since March and the highest August level on record.
Home prices may be heating up because the pool of homes for sale is shrinking. New listings fell from a year earlier in 44 of the 50 most populous U.S. metropolitan areas in August. By comparison, only 20 metros posted a year-over-year decline the prior month. Meanwhile, there was an increase in the number of metros seeing prices climb; 42 of the 50 top metros saw median sale prices rise from a year earlier in August, compared with 31 metros in July.
Still, there are far more sellers in the market than buyers, meaning buyers in many areas are able to find deals and get concessions from sellers.
Homebuyer Competition Remains Sparse as Sellers Far Outnumber Buyers
While sellers have been retreating, they still outnumber buyers by 35.2%—the second largest margin on record. There were 3.3 months of for-sale housing supply in August—the highest August level in a decade.
Supply is building in part because a lot of homes are lingering on the market. The typical home that went under contract last month did so in 47 days, marking the slowest August since 2016. The typical home also sold for 1.2% less than its final asking price—the steepest August discount since 2019.
As one real estate professional explained:
“It definitely feels like a buyer's market. Most homes for sale today only get one offer. I see multiple offers occasionally, but not multiple super strong offers like we saw during the pandemic homebuying frenzy—now they'll come in lower than the seller wants or the buyer will ask for concessions like money toward closing costs.”
Sellers in some markets are starting to get smarter about pricing competitively in order to sell their homes quickly.
August 2025 Metro-Level Highlights
The figures below are based on a list of the 50 most populous U.S. metropolitan areas. Metro-level data are not seasonally adjusted. All changes below represent year-over-year changes.
Prices:
Median sale prices rose most in Detroit (10%), Cleveland (8.7%) and New Brunswick, NJ (7.8%). They fell in seven metros, with the largest declines in Dallas (-3.3%), West Palm Beach, FL (-1.7%) and Phoenix (-1.1%).
Pending sales:
Pending sales rose most in Pittsburgh (11.4%), Cleveland (8.6%) and Phoenix (6.4%). They fell most in Detroit (-8.6%), Miami (-8%) and Seattle (-8%).
Closed sales:
Home sales rose most in Indianapolis (8.9%), Houston (6.8%) and Phoenix (4.1%). They fell most in Las Vegas (-15.8%), Fort Lauderdale, FL (-13.4%) and Miami (-13.1%).
New listings:
New listings rose in six metros, with the largest increases in Pittsburgh (3%), Detroit (2.9%) and New Brunswick (2.6%). They fell most in Orlando, FL (19.6%), Fort Lauderdale (-15.4%) and Tampa, FL (-15.3%).
Active listings:
Active listings rose most in Las Vegas (23.7%), Dallas (18.1%) and Anaheim, CA (17.8%). They fell in three metros: San Francisco (-7.4%), San Jose, CA (-2.8%) and Chicago (-1.7%).
Sold above list:
Newark, NJ led with 62.5% of homes selling above their final list price, followed by Nassau County, NY (58.7%) and Milwaukee (48.9%). The lowest shares were in West Palm Beach (5.9%), Fort Lauderdale (7.2%) and Miami (7.8%).
Days on market:
In Miami, the typical home that went under contract did so in 89 days, up 23 days from a year earlier—the biggest increase among large metros. Next came Fort Lauderdale (+21 days) and Riverside, CA (+20 days). The smallest increase was in Kansas City, MO (+0 days), followed by Minneapolis, Milwaukee, Philadelphia and Chicago, which all saw an increase of just 1 day.