
US Residential Real Estate Market Report - July 2025
Table of Content
-
Homes Are Selling at the Slowest Summer Pace in a Decade
-
Why Homes Are Taking Longer to Sell
-
Home-Price Growth May Be Accelerating
-
Buyer Competition Remains Low
-
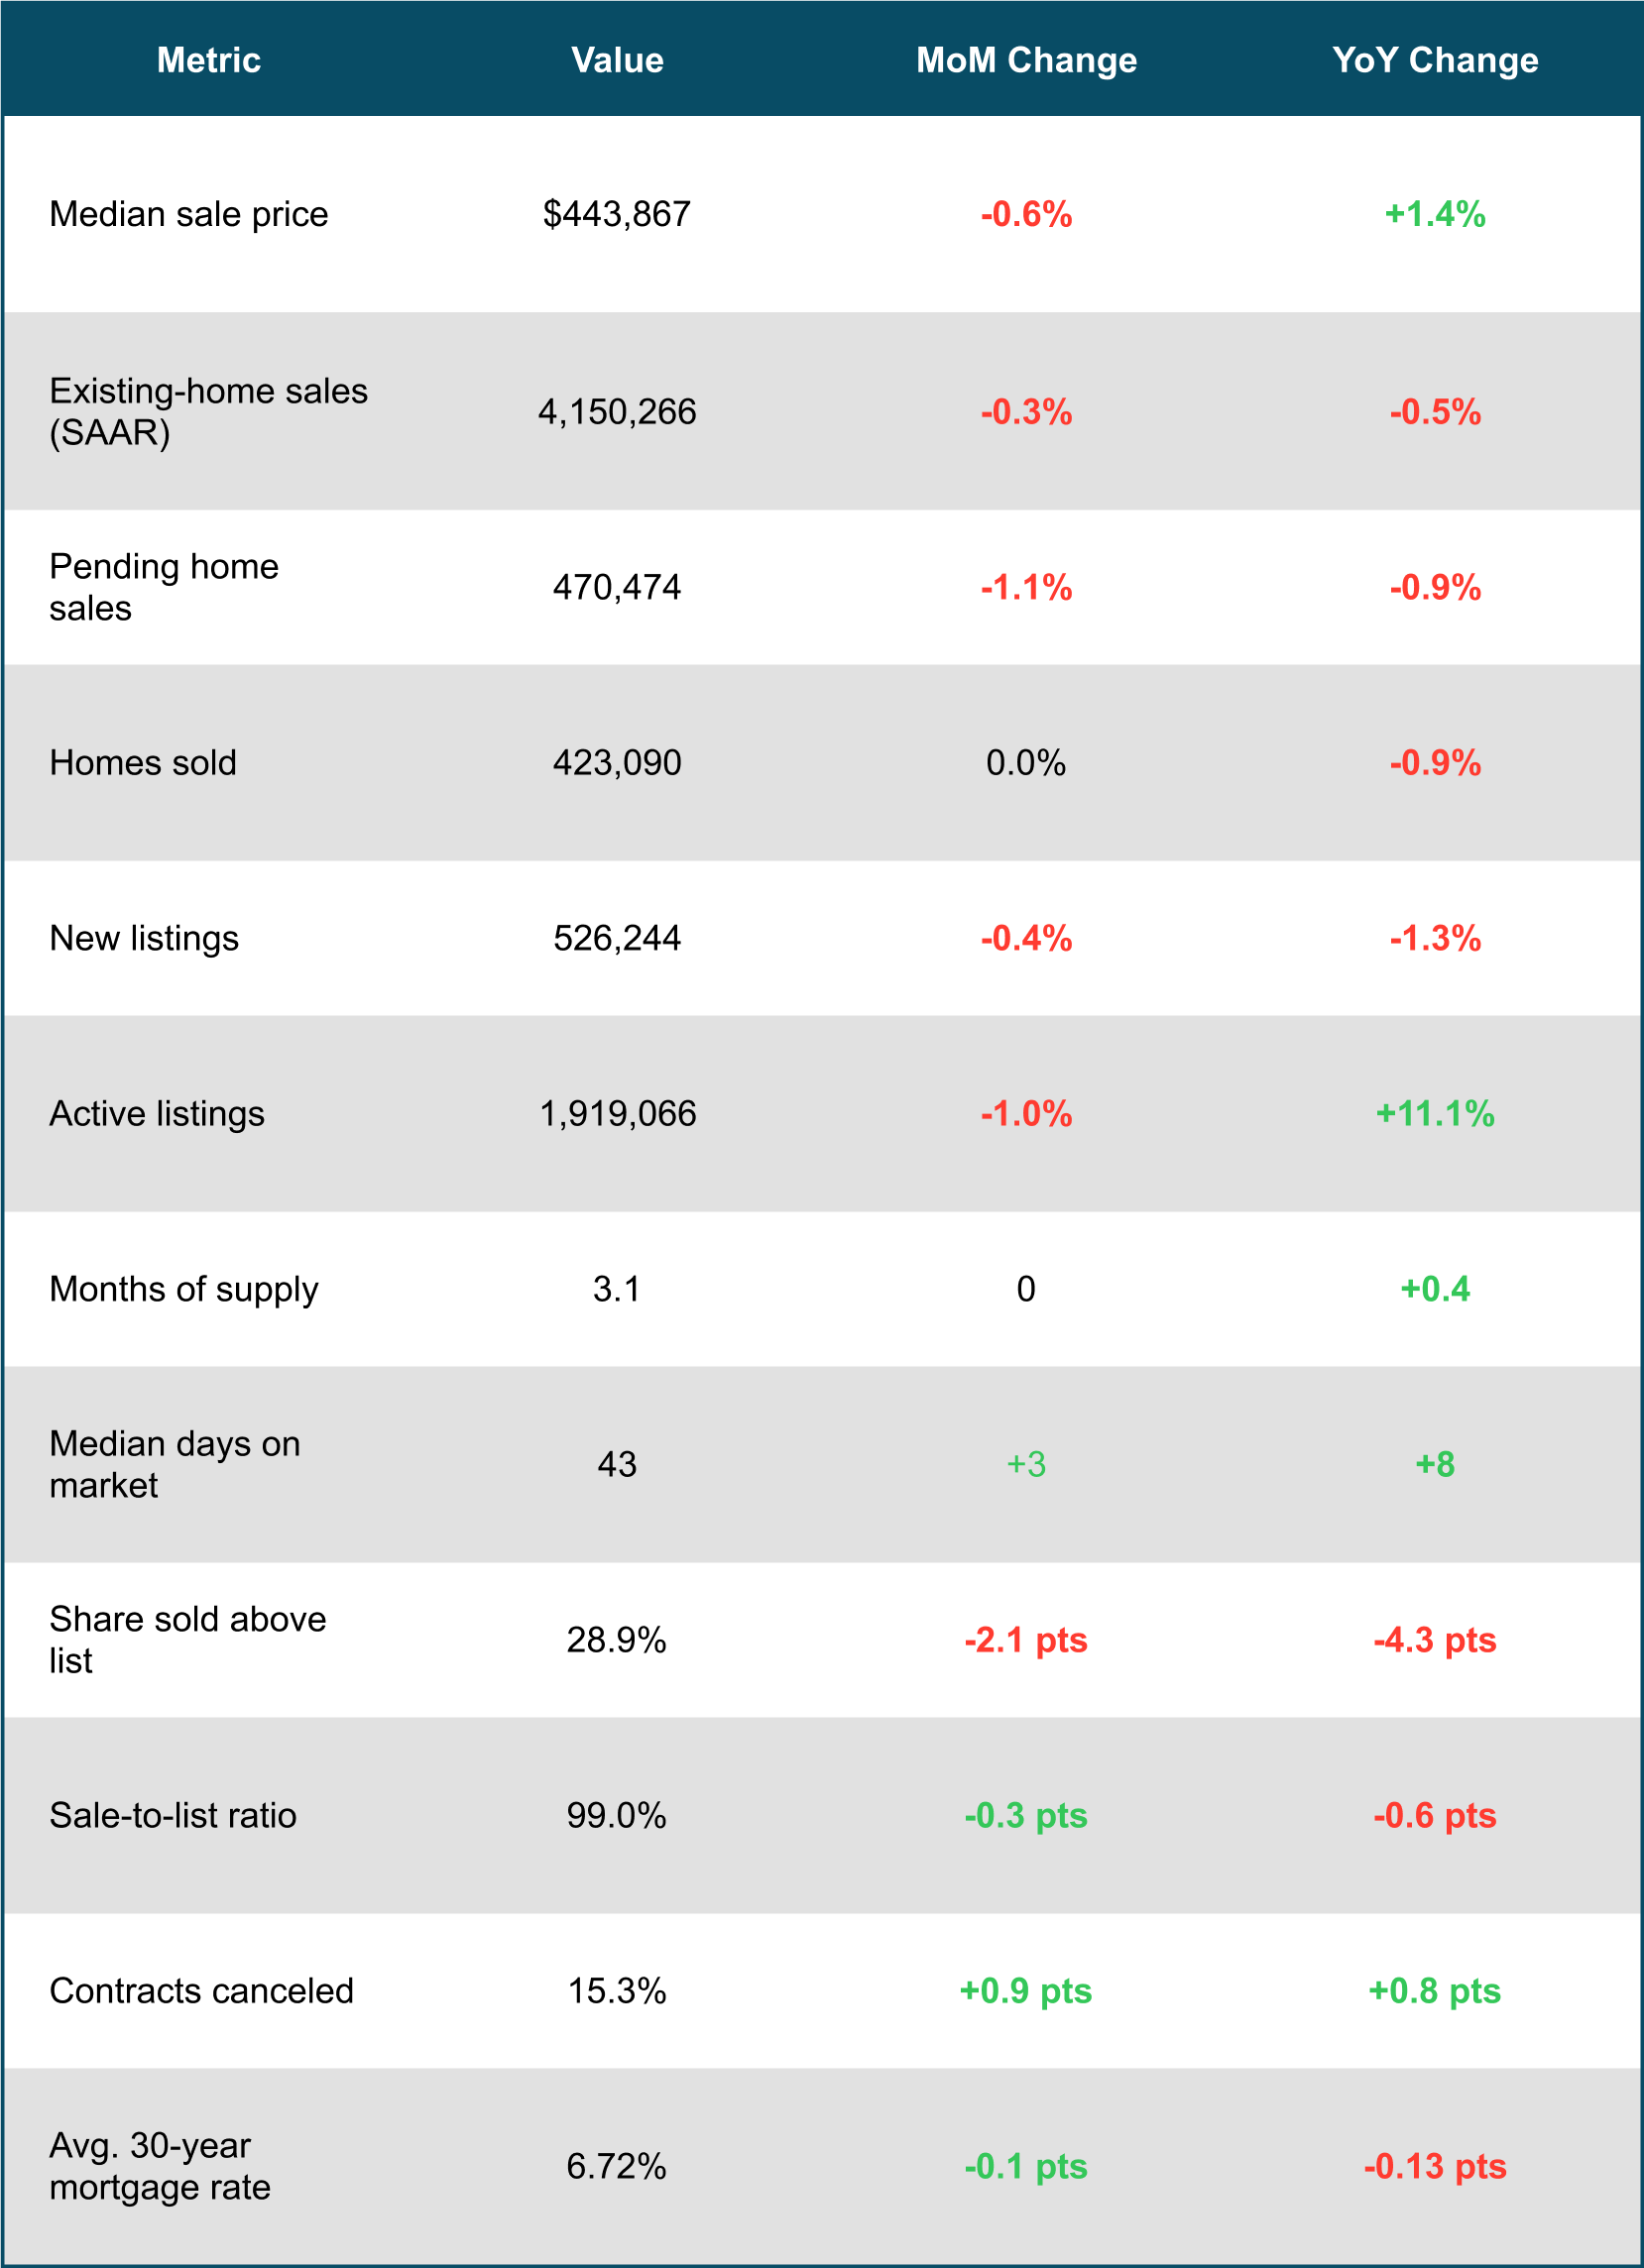
July 2025 Housing Market Snapshot - U.S.
-
July 2025 Metro-Level Highlights
-
Download Report as PDF
Homes Are Selling at the Slowest Summer Pace in a Decade
The typical home that went under contract in July sat on the market for 43 days—the longest July span since 2015—as pending sales hit a two-year low.
Some sellers are responding by not listing at all; active listings posted the largest monthly drop since 2023.
Home prices rose 1.4% year over year, a faster pace than in recent months, likely due to shrinking supply. The good news for buyers is mortgage rates have recently fallen.
The typical home that went under contract in July was on the market for 43 days. That's up from 35 days a year earlier and is the longest span for any July since 2015.
Why Homes Are Taking Longer to Sell
Homes are lingering because demand is shrinking under the weight of high costs and economic uncertainty. Pending home sales fell 1.1% month over month in July to the lowest seasonally adjusted level since November 2023. Existing-home sales dipped to an annualized rate of 4.15 million, the lowest in nearly a year.
With more homes staying on the market, supply has been building, giving buyers more choices and less urgency. Active listings in July hovered near a five-year high but still fell 1.1% from June—the largest monthly drop in almost two years. New listings also declined, slipping 0.4% month over month to the lowest level since March 2024.
Some sellers are holding back after seeing neighbors' homes linger on the market or sell below asking. Others are pulling listings altogether, choosing to rent instead or wait until conditions improve.


Home-Price Growth May Be Accelerating
The median home sale price rose 1.4% year over year in July to $443,867—a record high for the month. By comparison, prices rose 0.9% in June and 0.7% in May. Earlier in the year, price growth was slowing, so this marks a shift.
Buyers have been waiting on the sidelines for months. Now sellers are also waiting, which is likely contributing to rising prices.
At the same time, mortgage payments have started to ease. The average 30-year fixed mortgage rate is now 6.58%, down from a mid-July high of 6.75%.
Buyer Competition Remains Low
The typical home that sold in July closed for about 1% less than asking—the biggest July discount since 2020. Less than one-third of homes (28.9%) sold above their final list price, the lowest July share since 2019.
Roughly 58,000 home-purchase agreements were canceled in July, equal to 15.3% of homes under contract that month—the highest cancellation rate for any July in records going back to 2017.
Overall, buyers have more negotiating power than in recent years due to weaker competition and more options. However, if supply continues to shrink, the balance could shift back toward sellers.
July 2025 Housing Market Snapshot - U.S.
July 2025 Metro-Level Highlights
Prices:
Biggest gains in Cleveland (+12.8%), Nassau County, NY (+7.1%), and Indianapolis (+7.1%). Largest declines in Oakland (-6.1%), Jacksonville (-3.9%), and West Palm Beach (-3.8%).
Pending sales:
Rose most in Phoenix (+11.2%), Austin (+6.8%), and Houston (+6.1%). Fell most in Portland (-12.6%), Miami (-11.8%), and Tampa (-11.7%).
Closed sales:
Rose most in Houston (+4.8%), Virginia Beach (+3.7%), and San Francisco (+3.2%). Fell most in Miami (-20.2%), San Antonio (-15.3%), and San Jose (-10.1%).
New listings:
Rose most in Houston (+26.9%), Montgomery County, PA (+7.4%), and Cleveland (+7.1%). Fell most in San Francisco (-19%), Jacksonville (-15.6%), and Tampa (-13.5%).
Active listings:
Rose most in Las Vegas (+28.4%), Houston (+25.5%), and Dallas (+23.6%). Fell in San Francisco (-11.2%), Nassau County (-4.4%), Portland (-1%), and Kansas City (-0.9%).
Sold above list:
Highest share in Newark, NJ (67.2%), Nassau County (59.9%), and Milwaukee (54.3%). Lowest in West Palm Beach (6.4%), Fort Lauderdale (7.7%), and Miami (7.9%).
Days on market:
Longest in Fort Lauderdale (92 days, +23 YoY), West Palm Beach (+18 days), and Miami (+18 days). Kansas City was the only metro where time on market decreased (-6 days YoY).